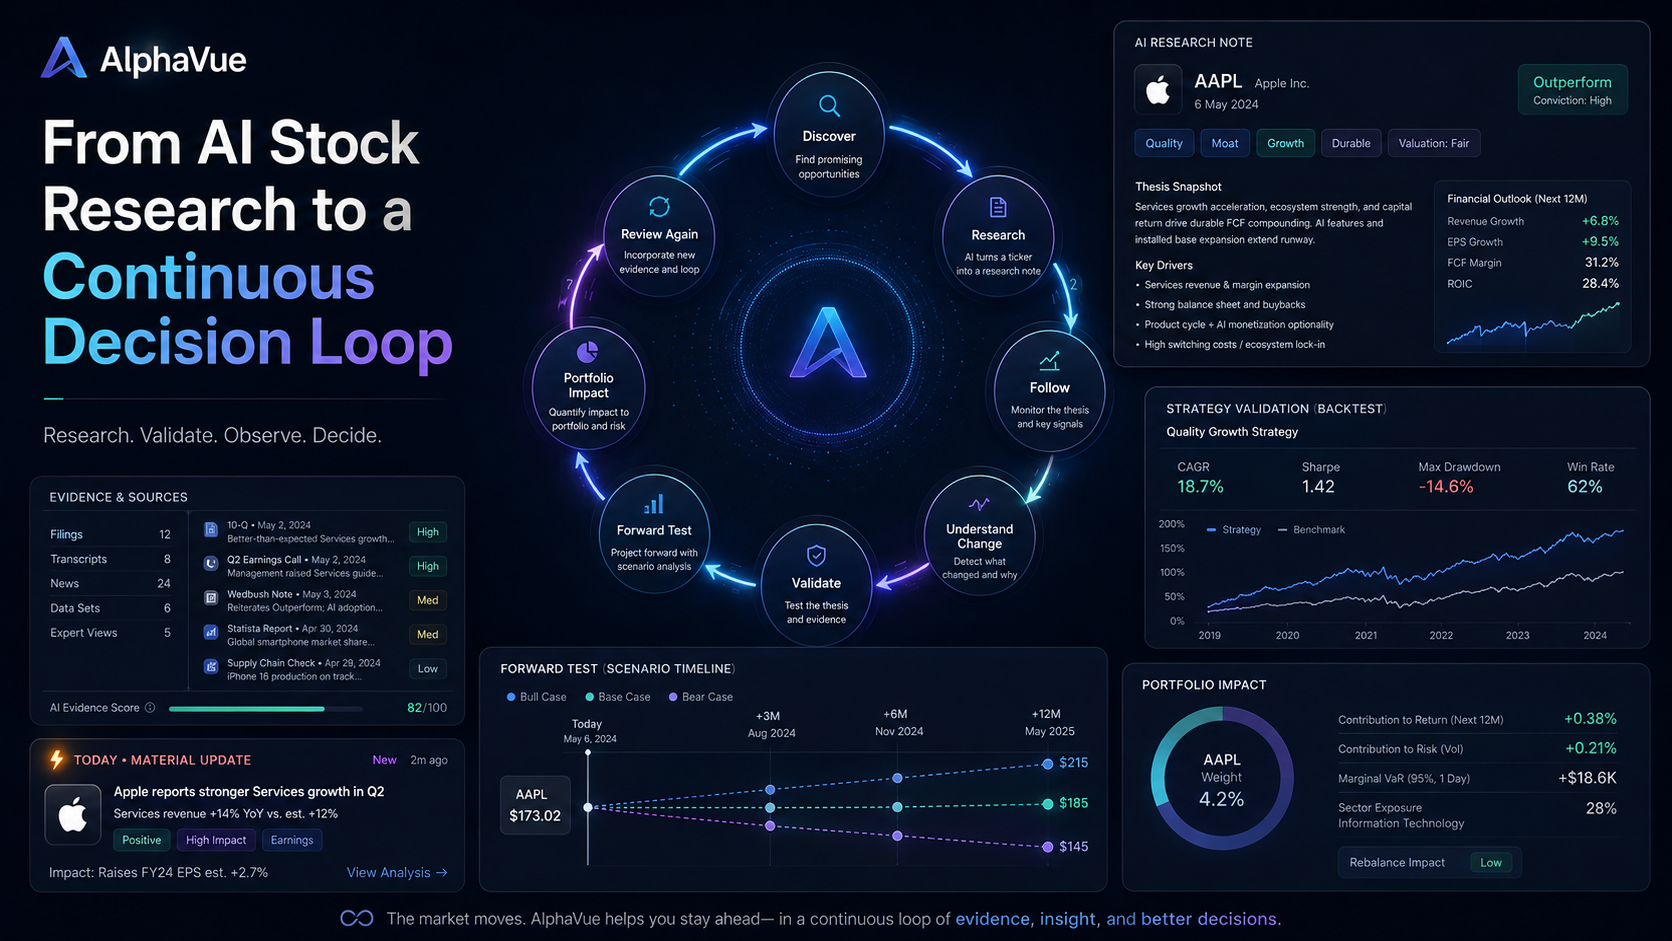
AlphaVue has always been good at one job: turning a ticker into a structured research note. You enter a company, and the platform assembles the financials, valuation, risks, and sources into something you can actually read. That capability is still here, and it still matters. What this release adds is everything that happens after the note lands.
A research note is a snapshot, and snapshots age. Companies keep reporting, prices keep moving, estimates keep getting revised, and a conclusion that made sense three months ago can stop making sense without any single dramatic event. The hard part of stock research is rarely the first read. It is keeping track of what changed, deciding whether your original reasoning still holds, and understanding what a new fact means for the stocks you already own.
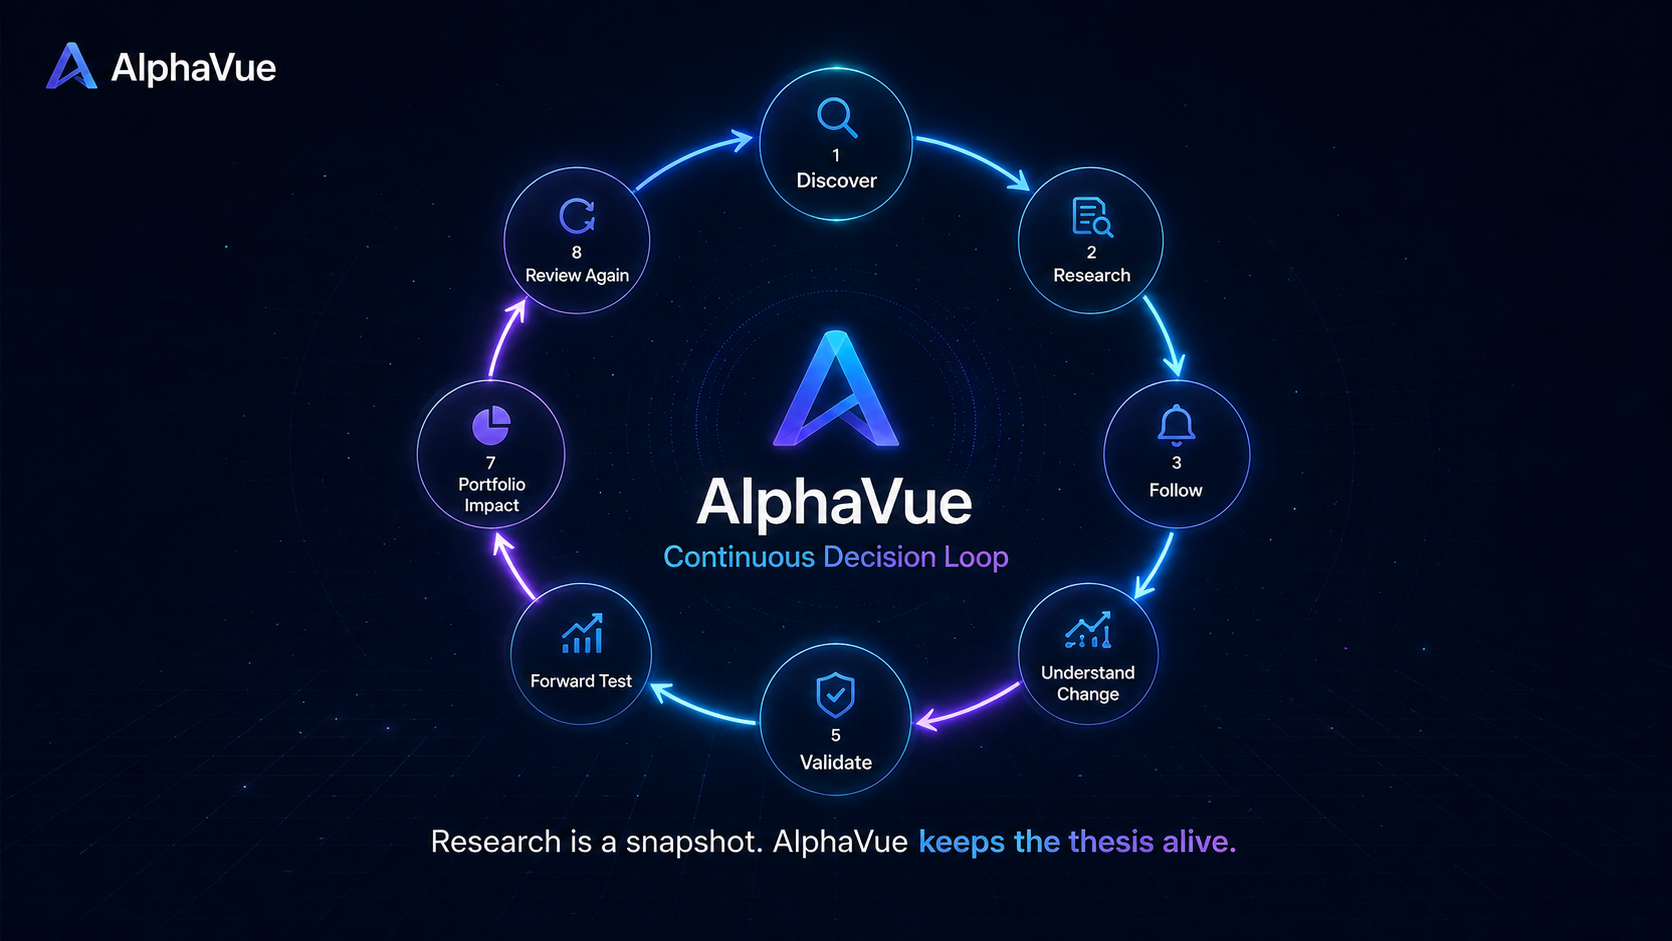
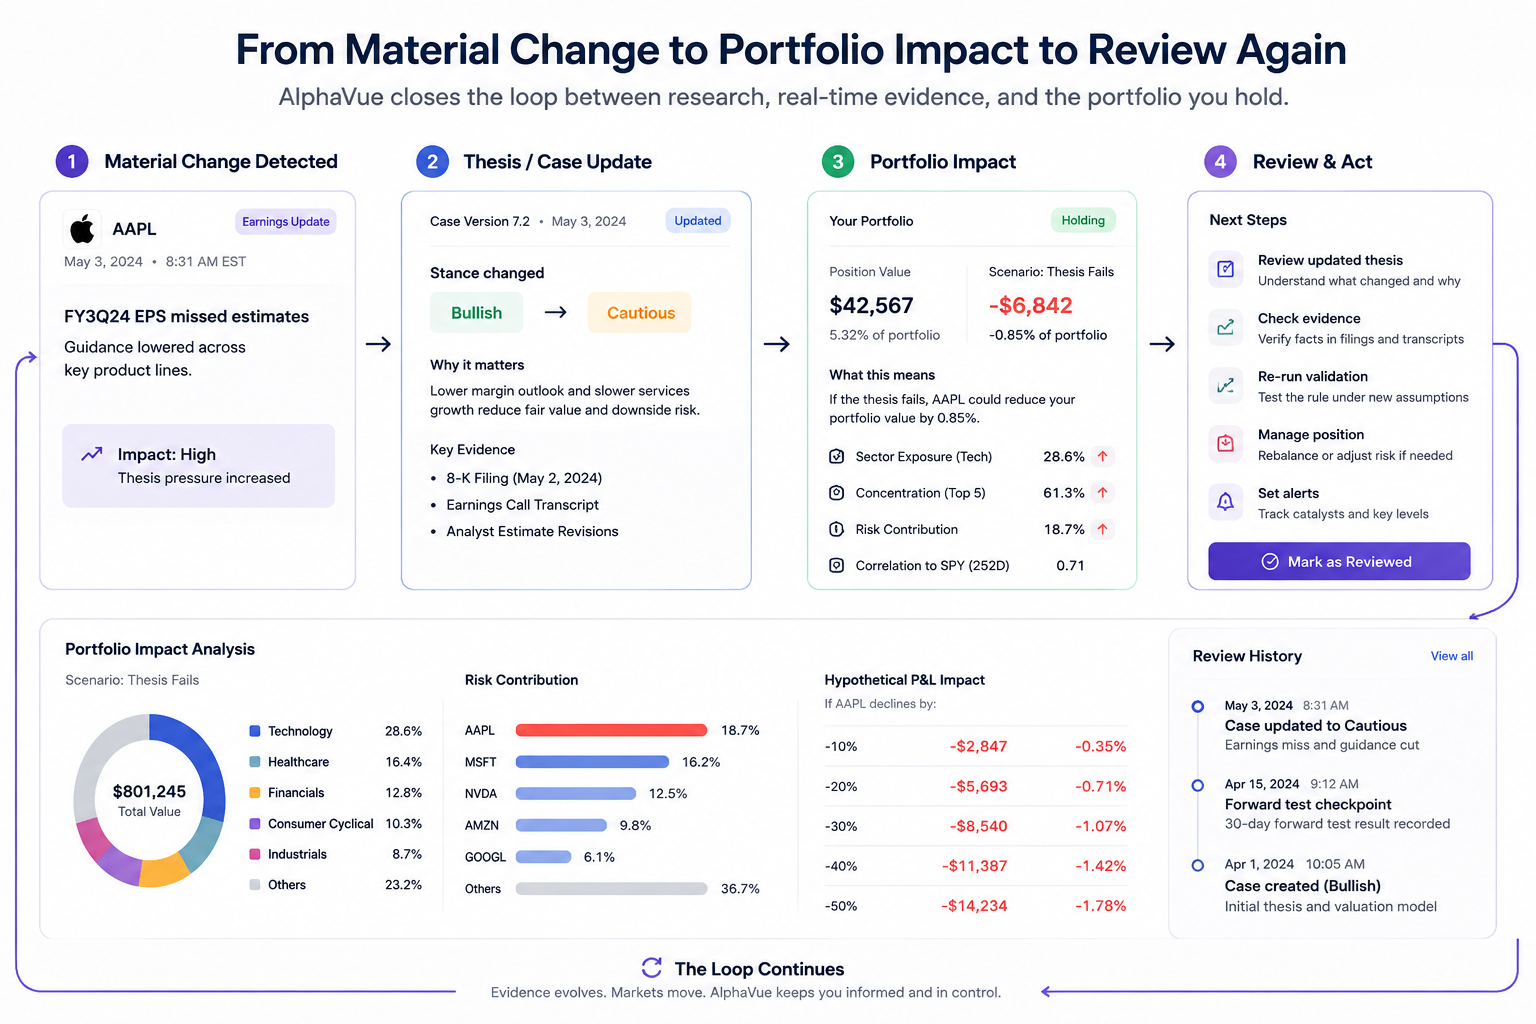
That second half is what this update is about: turning an AI stock research platform into an investment decision system. AlphaVue now keeps durable state around its analysis: versions of the research, the evidence behind each version, the outcomes it produced, and the alerts that follow it. The product is organized around one loop, and every new surface in this release sits somewhere on it:
Discover → Research → Follow → Understand change → Validate → Forward test → See portfolio impact → Review again.
Here is what shipped, what each piece does, and how to use it.
Why a report is not enough
The limit of most AI stock research tools is not the quality of a single answer. It is what the answer does for you afterward.
A typical workflow looks like this: you ask for an analysis, you read it, you maybe save it, and then the process ends. The report does not remember itself. It does not tell you when a new filing contradicts an assumption it made. It does not re-run when the market reprices the stock. If you come back three weeks later, you are effectively starting over, and unless you kept notes, you may not even notice that the original conclusion has quietly stopped being defensible.
Investors do not actually need more reports. They need answers to a smaller set of recurring questions:
What changed since I last looked at this company?
Which new claim is supported by evidence, and where is that evidence?
Would this idea have worked historically, and under what conditions?
Does the idea work going forward, without the benefit of hindsight?
What does a change mean for a portfolio that already holds the stock?
Those questions share a property: they all require state. You need the old version of the analysis to compare against the new one. You need frozen inputs to replay a decision fairly. You need a start date that predates the outcome to call a test honest. A tool that only generates reports cannot answer any of them.
So AlphaVue was rebuilt around a loop instead of around a document. Discover a company, research it, follow it, understand what changes, validate the hypothesis, watch it forward, check the portfolio impact, and review the whole chain again. The analysis is still the engine. The product is the loop.
Consider how a typical mistake forms. You read an analysis of a company in April. The report is solid, and the valuation looks reasonable. Two months later the company guides down, the stock drops, and the original thesis quietly breaks. The report never tells you, because a report cannot tell you anything once it is written. What you needed was not a better report in April. You needed a system that would notice the guidance change, attach it to the thesis, show you the evidence behind the new conclusion, and explain what the change does to a position you hold. That is the gap this release closes.
Today: a decision feed that tells you what changed
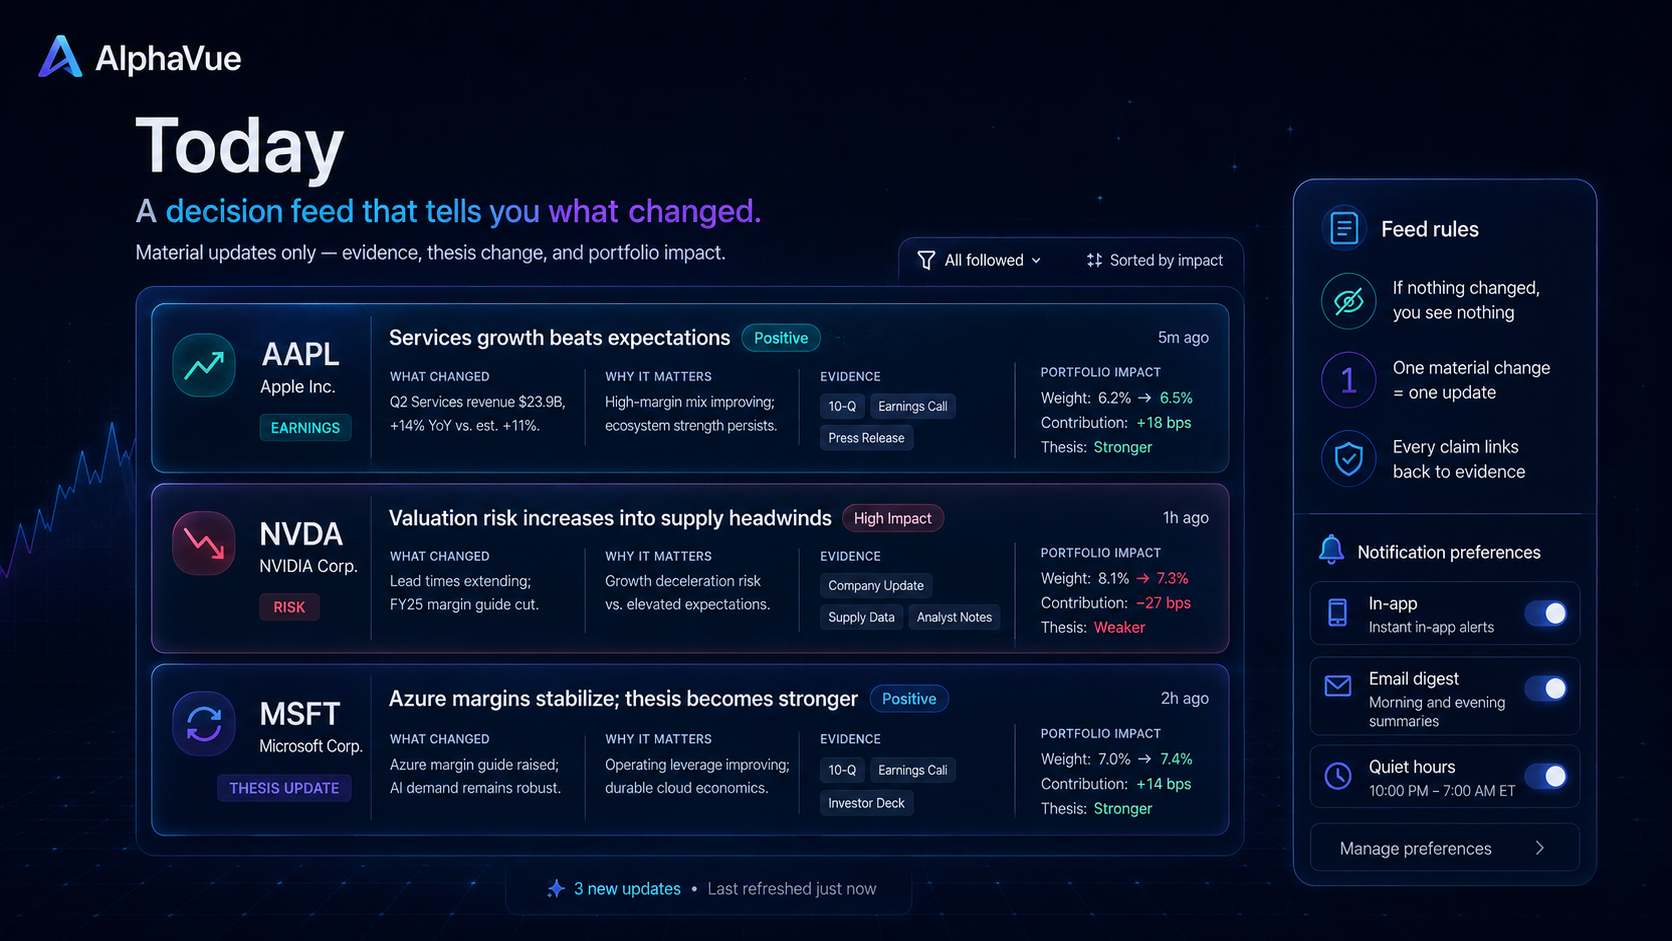
The first thing you see after logging in is no longer a generic dashboard. It is Today, a personal feed built from the companies you follow.
An item appears in the feed when something material happens: new evidence that supports or undermines the current thesis, a risk change, a catalyst, an observed outcome, or a shift in the research stance itself. Each change produces one update, deduplicated, instead of a pile of overlapping notifications. The update shows what changed, why it matters, the current thesis, the supporting evidence, and, when available, what the change means for a portfolio that holds the position.
The feed is built on a simple contract: if nothing changed, you should see nothing. That sounds obvious, but most alerting systems violate it daily by sending volume instead of signal. AlphaVue treats an update as a rare event worth reading, not a marketing touchpoint. Updates you have already reviewed stay out of the way, and the feed loads in batches so it stays responsive even as your follow list grows.
Following is how the feed gets built. You follow the companies you care about from the research workspace, and registration is deliberately lightweight: it preserves the symbol you were looking at and the update you were reading, and it returns you to the same place after sign-up. That return path matters more than it looks. The moment a visitor registers, the product should continue the task they were already doing, not drop them onto a generic welcome screen.
Notifications respect the same discipline. Preferences are set per company and per channel: in-app alerts, an email digest, quiet hours. Unsubscribing actually unsubscribes, and a single material change produces a single delivery pointing at the exact case version. Duplicate and no-change events produce nothing.
The evidence ladder on the home page
The home page now leads with the same idea in simpler form: Research, Validate, Observe, Decide. It is not a slogan. Each rung of that ladder maps to a surface in the product, and the ordering is intentional.
Research is where you form a view of a company. Validate is where you test that view against history instead of accepting the narrative. Observe is where you freeze the surviving view and let real time produce evidence. Decide is where you act with a record of what you believed and what has happened since. The ladder is a way of saying that an AI opinion becomes useful only when it moves through stages that can be checked.
That framing changed what the product promises. The old home page described an AI platform and let the process speak for itself. The new one asks for a smaller, more concrete commitment: test one thesis, follow the evidence, and see whether the reasoning holds up. The difference matters, because a product that asks for a smaller commitment is a product a serious investor is more likely to try.
The company research workspace is now a terminal
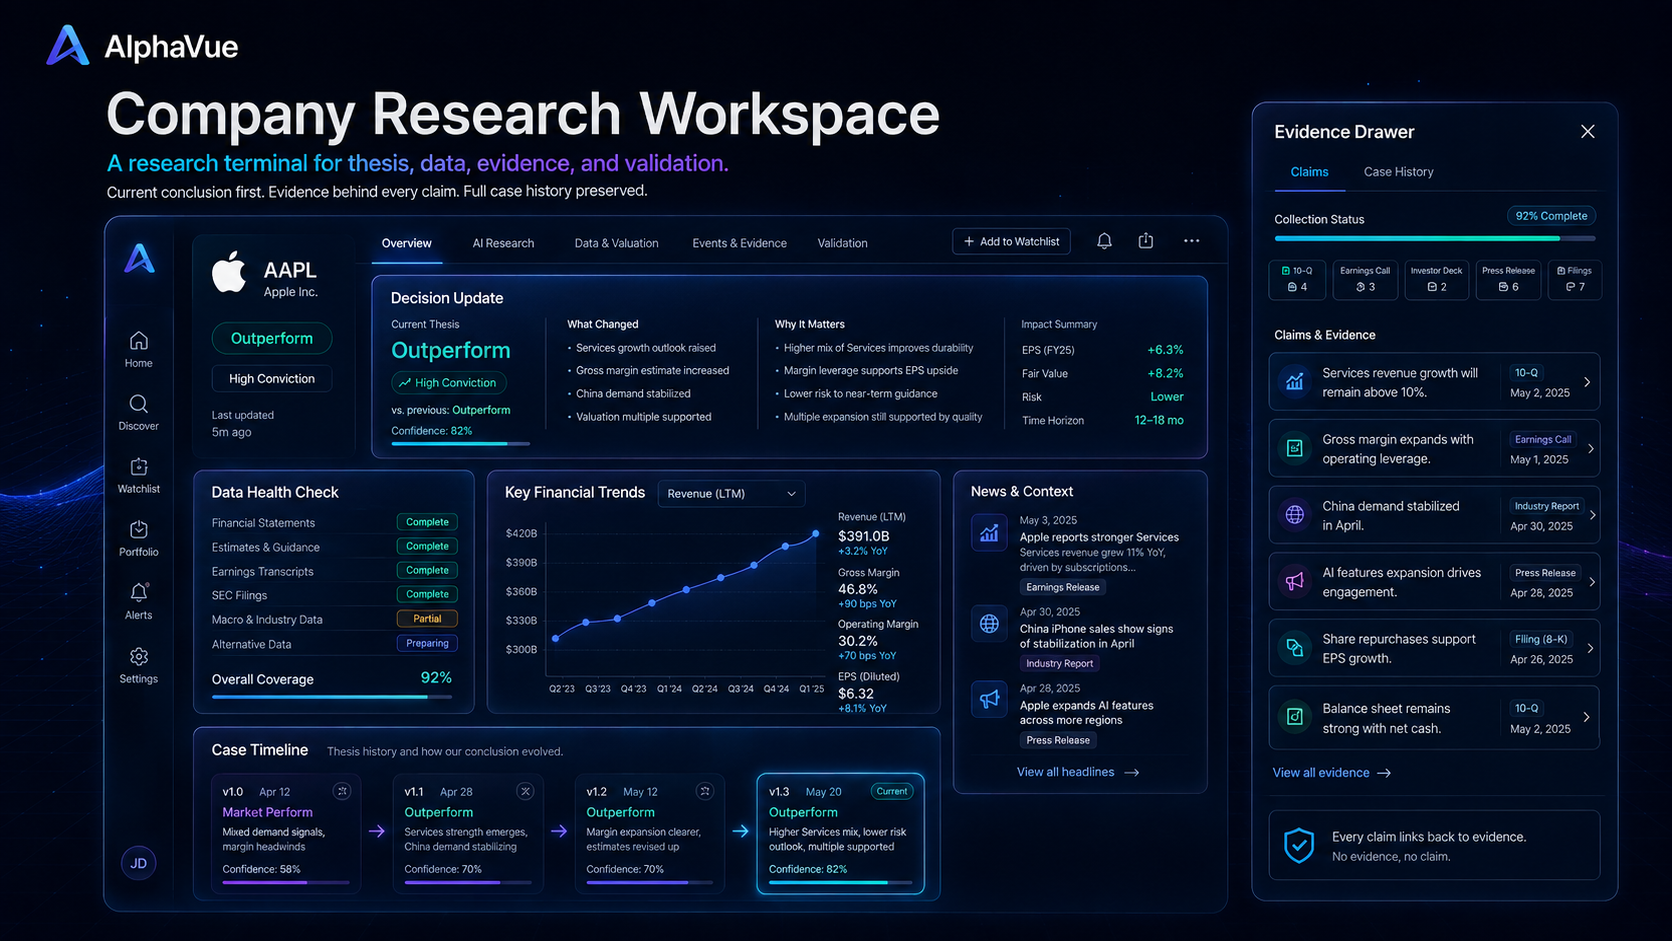
When you open a company, you get a tabbed workspace instead of one long scrolling page. The tabs separate jobs that used to be mixed together:
Overview — the current conclusion, a data health check, and the history behind both.
AI Research — the deep, multi-perspective research process, kept as the core analytical layer.
Data & Valuation — the numbers, the financial trends, and the valuation view.
Events & Evidence — filings, catalysts, and the original sources.
Validation — rules, backtests, AI replay, and forward observations.
The Overview tab now follows a deliberate reading order: current conclusion first, then a data health check, then the historical review. The previous layout stacked several "what do we think" blocks on top of each other, each answering roughly the same question from a slightly different angle. The new one makes the answer unambiguous first and then shows you how it was reached.
The decision update block sits at the top of the Overview. It states the current view, what changed since the last version, and what evidence supports the change. Below it, the data health check tells you which sections are complete, which are partial, and which are still preparing, so you are never guessing whether an empty area means "no data" or "not collected yet." The historical review underneath connects the present view to the case timeline, so you can see how the thesis has evolved rather than treating each visit as a fresh start.
There is also a company news tab. Headlines are contextualized instead of dumped: the workspace distinguishes reported company facts from third-party interpretation, and important news is linked back to the underlying announcement or filing when the source allows it. A headline should not automatically become a thesis, but it should point you to the document that deserves verification.
The four-dimensional health check that used to rely on vague dots and bare mini-charts is now explicit. Every metric shows its value, its direction, its period, and its data dimension. The financial trend chart lets you choose the metric, unit, and time range, shows the latest value, and explains what changed. If a dimension has no reliable data, it stays hidden instead of being filled with a neutral placeholder. Presenting absence as evidence was a quiet source of confusion; removing it was one of the more honest changes in this release.
Apply this research method to your stock
Enter one ticker and get a research summary you can keep exploring.
The Company One-Pager still exists as the fast path: market context, reported facts, financial history, filings, and upcoming events in one structured view. It is the right place to start when you need a thirty-second orientation. The tabbed workspace is what you move into when the question gets specific.
Freshness is treated as part of the content, not as a detail. The research snapshot shows when it was generated and whether it is current, stale, or partial, so you never have to guess whether the view in front of you reflects the last filing. The case timeline keeps every version of the thesis with a structured view of what changed between them: the previous conclusion, the new one, and the evidence that drove the difference.
The evidence drawer sits behind the claims. Each material statement carries its source and collection status, and opening a claim shows the original material rather than asking you to trust the summary. This is the layer that turns "the AI said so" into "the AI said so, and here is the filing it is based on."
Strategy Lab: test the rule before you trust the idea
Most stock ideas are really trading rules in disguise. "This company is under-owned" becomes "buy when the market is mispricing it." "The sector is turning" becomes "buy the leaders, avoid the laggards." Strategy Lab exists to test that second layer, the part you can actually measure.
You can run a stock backtest with technical rules without writing code. Pick a rule or a combination of rules, choose the universe and date range, set the benchmark and costs, and the platform runs the job asynchronously and returns a result that leads with a plain-language verdict. The statistics are there, but they come after the answer, not instead of it.
Below the verdict you get the assumptions, the sample, the benchmark comparison, drawdown, robustness measures, and fees. Walk-forward windows and parameter sensitivity show whether the result survives changes in inputs or just happened to work once. The distinction matters: a rule that only works with one specific lookback period is a description of luck, not a strategy.
A concrete example helps. Suppose you want to test a simple trend rule: buy when the 50-day average crosses above the 200-day average, sell when it crosses back. Strategy Lab lets you set that rule, choose the universe and date range, and run it against the SPY benchmark. The result tells you not just the return but how many trades the rule actually made, how the equity curve behaved through drawdowns, how sensitive the outcome is to the two lookback windows, and what costs would do to it. You may decide the rule is fine, or you may decide the edge is eaten by fees. Either way you now know, and you know it before risking anything.
The no-code strategy builder ships with sensible defaults. Dates are prefilled, an entry rule is already in place, and a staged progress bar makes it clear where a long run stands. When a backtest produces no signals or an all-hold result, the workspace explains why instead of showing an empty chart. The benchmark is locked to SPY, which removes a common source of silent bias: you cannot quietly pick a benchmark that flatters the strategy.
Validation extends beyond a single run. The workspace reports coverage, so you can tell whether a result is based on a handful of trades or hundreds, and it flags sample quality rather than hiding it. Event studies isolate how the strategy behaved around specific market events. Reports can be exported, and saved runs can be compared side by side, which turns a one-off test into a small research library of its own.
One boundary is stated plainly in the product: a backtest is not a prediction. It is a description of how a rule behaved on past data, with fees, survivorship, and regime changes all capable of distorting the picture. Strategy Lab tries to make those distortions visible. The verdict line, the sample note, and the fee breakdown exist for that reason.
AI historical replay: rerun the research at a point in time
Backtests test rules. AI historical replay tests the research itself.
The idea is straightforward: take an AI research run and redo it as of an earlier date, using only the evidence and data snapshots that existed at that time. The replay shows what the system would have concluded before the outcome was known: which model version, prompt, data version, and sources it used, and what it flagged as the key risks. That is useful for auditing a past decision. Did the research ask the right questions at the time, or does it only look impressive in hindsight?
Replay is deliberately separate from deterministic backtesting. A backtest replays a fixed rule; a replay reruns an open-ended research process. They answer different questions, and they are labeled differently in the product so you never mistake a research replay for a statistical test.
When a published decision does not have a frozen research bundle attached, the platform falls back to the latest private analysis rather than returning an error, and it is honest about which version it replayed. The result always shows the model, prompt, and data versions used, because a replay you cannot reproduce is not much of an audit. Replays are credit-based and bounded in universe and cost, which keeps the feature usable without turning into an open-ended computation bill.
Forward test: the only test that cannot cheat
Here is the difference between a backtest and a forward test in one sentence: a backtest asks whether the idea would have worked; a forward test asks whether it works from now on.
Hindsight is the hardest bias to remove from backtesting. You know what happened, so you know which parameters to pick, which regime to highlight, and which period to call normal. No amount of walk-forward discipline fully removes that advantage. A forward test removes it by construction: the strategy is frozen before the results exist, and the results simply cannot be backfilled.
When you start a forward test, AlphaVue freezes the strategy version, its parameters, the data contract, the starting capital, the benchmark, and the start time. From that moment, the platform runs a paper ledger — orders, fills, net asset value, checkpoints — on the real market calendar. You can pause, resume, or stop the test, and every event is immutable. There is no mechanism to rewrite history, because there is no history: the record starts at creation and grows only forward.
Forward tests produce something backtests cannot: observations made before the outcome. After enough checkpoints, a material forward outcome can generate an update in the decision feed, closing the loop between validation and daily monitoring. This is the part of the product that most directly matches the promise of the release: know what changed, and whether the thesis has held up.
Portfolio impact: what a change means for what you hold
A decision update can be correct and still useless if it ignores that you already own the stock. Portfolio impact is the bridge between research and your actual positions.
You can create a portfolio by hand or import it from CSV, including positions, cost basis, and cash. AlphaVue computes exposure, concentration, sector breakdown, correlation, and risk contribution deterministically. The goal is not to sound sophisticated. It is to answer a concrete question: if this thesis fails, how much of my portfolio is affected, and through which positions?
Every decision update that touches a holding can be viewed through three scenarios: the situation now, the situation if the thesis fails, and the situation if the position changes. The portfolio impact history keeps a record of those views over time, so you can see how your risk profile has shifted alongside the research rather than relying on memory.
An example makes it concrete. You hold a position in a company whose research stance has just moved more cautious. The portfolio view shows how large that position is relative to the total, how much of the portfolio sits in the same sector, and what the scenario math implies if the thesis fails. Those are facts you can weigh. They are not instructions to sell, and the product never pretends they are.
The product draws a firm line here. It explains what a change means for a portfolio, and it never issues personalized trade instructions. Scenario math describes what would happen under stated assumptions; it does not tell you what to do. That line is part of the design, not a footnote, because the difference between "here is the impact" and "you should sell" is exactly where a research tool either helps or crosses into advice it is not licensed to give.
Research library, saved cases, and sharing
Research you cannot find again is research you did not do. The Saved workspace collects the things you want to return to: companies you are researching, investment cases with their histories, validation runs, forward tests, and exports. The decision inbox keeps the updates you have not reviewed yet, so the feed can stay focused on what is new rather than re-serving old items.
Sharing got a privacy pass in this release. You can share a research receipt: a read-only snapshot of what the research concluded, with private fields redacted and the public evidence attached. The recipient sees the conclusion, the evidence, and the attribution without seeing your portfolio, your notes, or your identity unless you choose otherwise. Sharing a conclusion used to mean pasting screenshots or exporting a document that carried more context than you intended. The receipt gives you a way to point someone at the reasoning without exposing the rest of your workspace.
A workflow worth copying
The new surfaces are useful individually, but they are designed to be used in sequence. A disciplined version of the loop looks like this:
Discover. Use discovery to find a company worth the time. Not every stock deserves a full research pass, and the fastest way to burn a morning is researching a company you have no reason to care about.
Research. Open the company workspace and start with the Overview. Read the current conclusion before forming your own, then check which parts of the data are complete.
Verify. Open the Events & Evidence tab and look at the original sources for the claims that matter. A summary is a starting point, not a substitute for the filing.
Validate. Before trusting an idea, run it through Strategy Lab. Test the rule, not just the narrative. Check the coverage, the benchmark, and the fee assumptions before you let the result change your mind.
Observe. If the idea survives validation, freeze it into a forward test and let the paper ledger accumulate real observations. The record is short at first. That is the point.
Review. When a material update arrives, check the portfolio impact, then revisit the case history to see whether the thesis is being confirmed or challenged.
The checklist is not a promise of better returns. It is a way to make the process repeatable, which matters more in the long run than any single call. A repeatable process is also the only way to learn from mistakes, because it gives you a record of what you believed, when you believed it, and what happened next.
What stayed the same
Not everything was rebuilt, and the parts that were kept are worth naming.
AI Research remains the analytical core. It is the process that produces the deep, multi-perspective analysis behind the decision layer, and it has not been weakened to make room for the new surfaces. Source citations still run through the product: every material claim traces back to the material it came from. The platform still supports multiple languages, including English, Chinese, and Japanese, with additional locales following. The responsive design still works from a phone to a wide desktop monitor, and the accessibility pass in this release covered the new workspaces, not just the marketing pages.
The reason to name these is that a capability update is easier to trust when it is clear what did not change. The decision layer is an addition around an analysis engine that was already there.
What AlphaVue still does not do
It is worth being explicit about the boundaries, because they are part of the product's honesty.
AlphaVue does not promise market-beating returns, and it does not present model confidence as a statistical win rate. It does not issue personalized trade instructions, and nothing in the research is a recommendation to buy or sell a security. Scenario outputs describe what would happen under stated assumptions; they do not account for your objectives, tax situation, or risk tolerance.
Data coverage varies by company, source, and reporting practices. Some datasets are collected on demand, so a section may be partial or still preparing, and the workspace shows that status rather than pretending the data is complete. Estimated event dates are labeled as estimates and should be verified through investor-relations materials. AI output can contain errors or omit relevant context, and market data can be delayed or affected by upstream problems. The right way to use this product is as one input in a process that also includes original filings and your own judgment.
Frequently asked questions
What is AlphaVue?
AlphaVue is an AI stock research platform for self-directed US equity investors. It produces structured company research with cited sources, and it now adds a decision layer: a personal feed of material changes, strategy validation, AI historical replay, forward testing, and portfolio impact analysis.
What is the AlphaVue decision feed?
Today is a personal feed of material updates for the companies you follow. An update appears when evidence, risk, a catalyst, an outcome, or the research stance changes. Each update links to the supporting evidence and shows the current thesis, so the feed answers one question: what changed since you last looked.
Can I backtest a stock strategy without writing code?
Yes. Strategy Lab supports no-code backtests with a visual strategy builder and technical rules. You choose the rules, universe, date range, and benchmark; the platform runs the test asynchronously and explains the result in plain language, including drawdown, robustness, fees, and limitations.
What is the difference between a backtest and a forward test?
A backtest tests a rule against historical data and is always exposed to hindsight bias. A forward test freezes a strategy at creation and records only what happens afterward on a paper ledger. Forward-test results cannot be backfilled, so they carry no hindsight advantage.
What is AI historical replay?
AI historical replay reruns an AI research process at an earlier as-of date using only the evidence and data snapshots available at that time. It is a research audit rather than a deterministic backtest, and it shows the model, prompt, and data versions used so the result can be reproduced.
How does portfolio impact analysis work?
You create a portfolio manually or import it from CSV. AlphaVue computes exposure, concentration, sector breakdown, correlation, and risk contribution, then shows what a decision update would mean for the portfolio under different scenarios, including the case where the thesis fails.
Is AlphaVue investment advice?
No. AlphaVue provides research information and tools. It does not account for your individual objectives, financial situation, tax position, or risk tolerance, and it does not issue personalized trade recommendations.
Does AlphaVue guarantee returns?
No. The platform does not promise market-beating returns, and validation and forward-test results describe behavior under stated assumptions rather than predicting future performance.
Which companies does AlphaVue cover?
Research coverage focuses on US-listed companies and varies by data availability. Coverage can be partial while datasets are being collected, and the workspace shows the collection status of each section so you are not left guessing.
How much does AlphaVue cost?
AlphaVue has a free tier and a Pro plan. The free tier provides limited analysis and a constrained set of validation runs; Pro adds higher quotas, deeper evidence, more follows, portfolio impact, and longer forward-test history. See the pricing page for current details.
How does AlphaVue avoid look-ahead bias?
Validation runs use versioned data snapshots and frozen inputs, so the analysis reflects only what was known at the as-of date. Forward tests go further: the strategy is frozen at creation, and results cannot be backfilled, which removes hindsight by construction. AI historical replay shows the model, prompt, and data versions used, so the process can be reproduced.
Is my portfolio and research data private?
Portfolio positions, notes, and saved cases are private to your account. Shared research receipts are read-only, with private fields redacted, and they expose only the conclusion and public evidence you choose to share.
Start with the change, not the report
The easiest way to see what this update means is to open a company you already follow and start with the Overview. Read the current conclusion. Check what changed. Look at the evidence. If the idea matters to you, run it through validation, and if it survives, freeze it into a forward test so the next review has something real to look at.
AlphaVue is still an AI stock research platform. It is just no longer a dead end after the answer.