
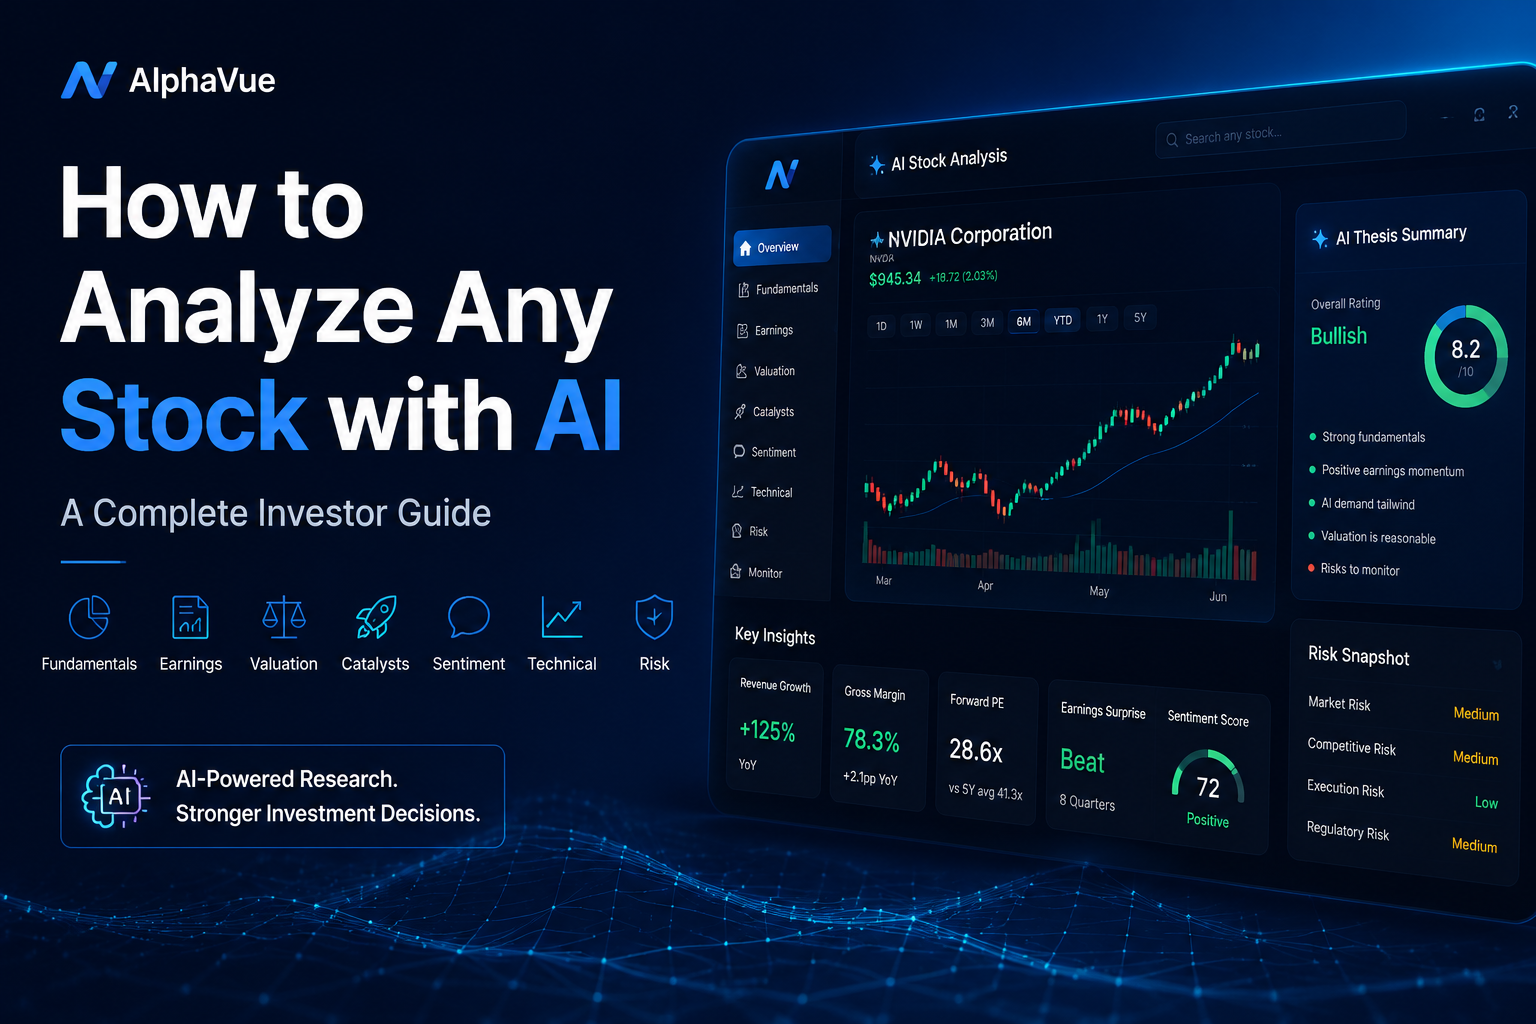
The difficult part of stock research is no longer finding information. It is deciding what matters, what is already priced in and what could change next.
Table of contents
An investor researching NVIDIA can open a price chart in seconds, download an earnings release in minutes and find thousands of bullish and bearish opinions before lunch. The same is true for Tesla, Apple, Microsoft, Amazon, Alphabet, Meta, AMD, Palantir and nearly every widely followed public company. Yet easier access to information has not automatically produced better decisions. In many cases, it has created a noisier version of the same uncertainty.
This is the real opportunity for AI stock analysis. Artificial intelligence can read more documents than an individual investor, compare periods more quickly and keep a research checklist consistent. But speed alone is not an investment edge. A fast summary of weak or irrelevant evidence is still weak research. The value comes from turning scattered facts into a thesis that can be explained, challenged and updated.
This guide presents a practical framework for using AI in stock research. It covers the underlying business, financial statements, earnings quality, valuation, catalysts, sentiment, technical signals and risk. It also explains how AlphaVue applies a multi-agent research process to help investors move from information overload to an evidence-based view.
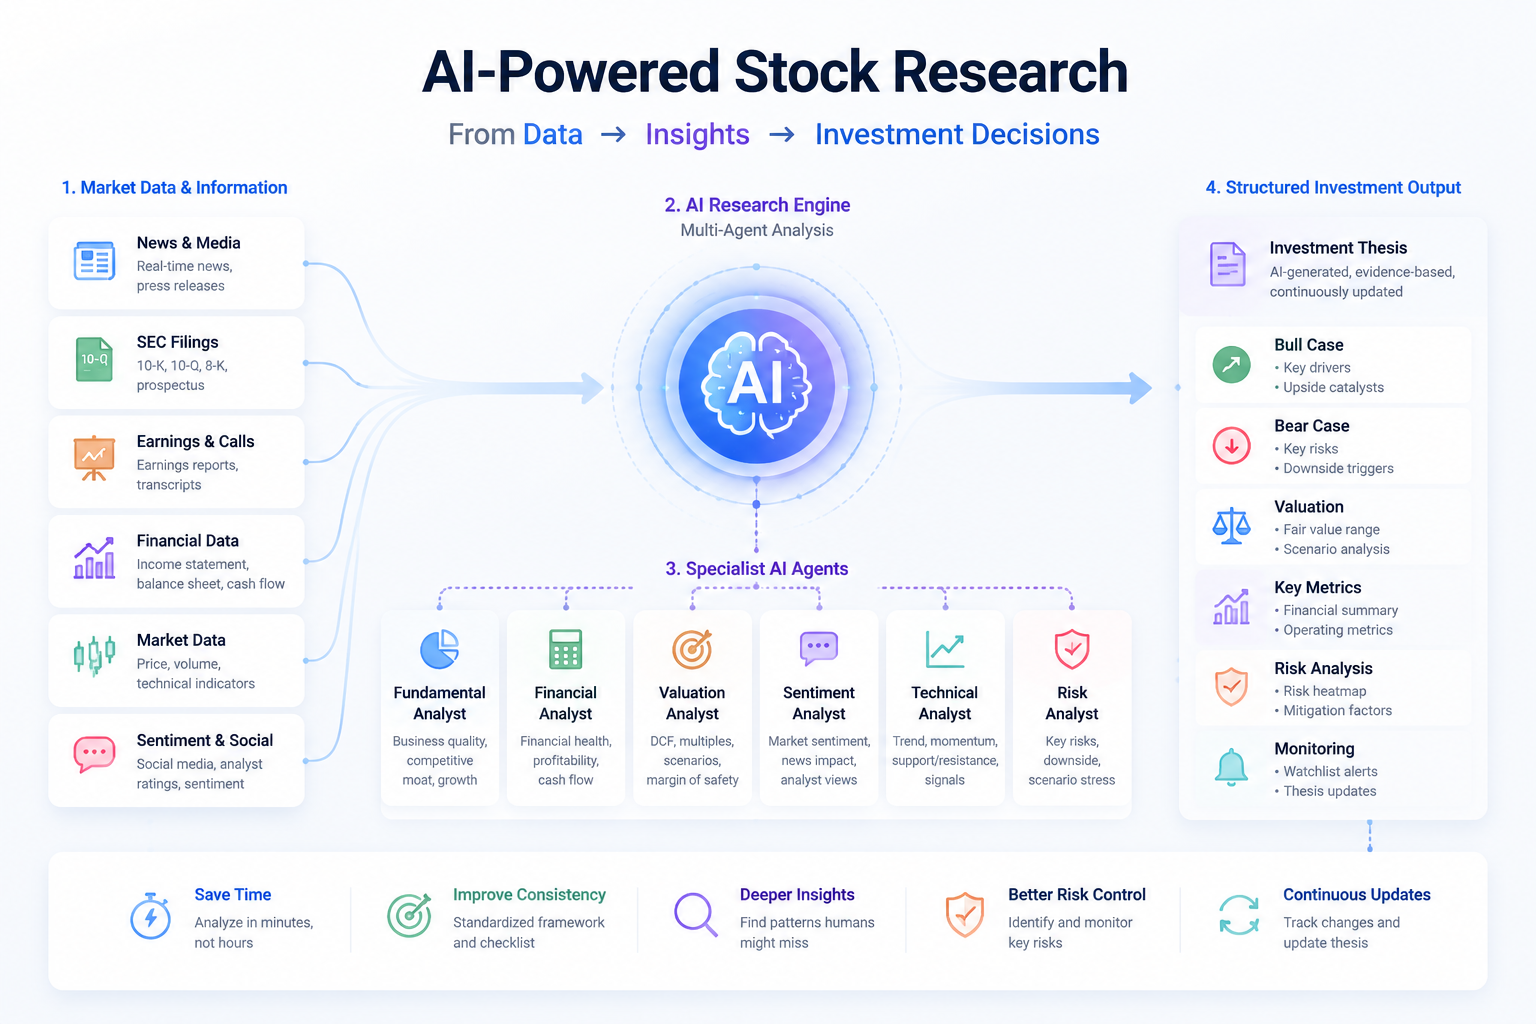
What does it actually mean to analyze a stock with AI?
Typing “What stock should I buy?” into a chatbot is not serious stock analysis. The question asks for a conclusion before defining the evidence, time horizon, risk tolerance or assumptions behind it. A persuasive answer may sound useful while hiding all the decisions that matter.
A credible AI stock research process should answer a more demanding set of questions:
How does the company make money, and which variables drive its economics?
Is the underlying business becoming stronger or weaker?
Are reported earnings supported by cash flow?
What growth, margin and risk assumptions are embedded in the current valuation?
Which future events could materially change those expectations?
What is the strongest case against the current investment thesis?
What evidence would prove the thesis wrong?
Has anything important changed since the analysis was created?
These questions require different types of evidence. Financial statements describe the economics of the business. Earnings calls reveal management’s priorities and explanations. Industry data provides competitive context. News can identify new catalysts. Price and volume show how the market is behaving. Sentiment indicates whether expectations are optimistic, fearful or divided. Risk analysis asks what could create a permanent loss rather than a temporary decline.
No individual signal is enough. AI becomes useful when it connects these layers without pretending that uncertainty has disappeared.
A seven-layer framework for complete stock analysis
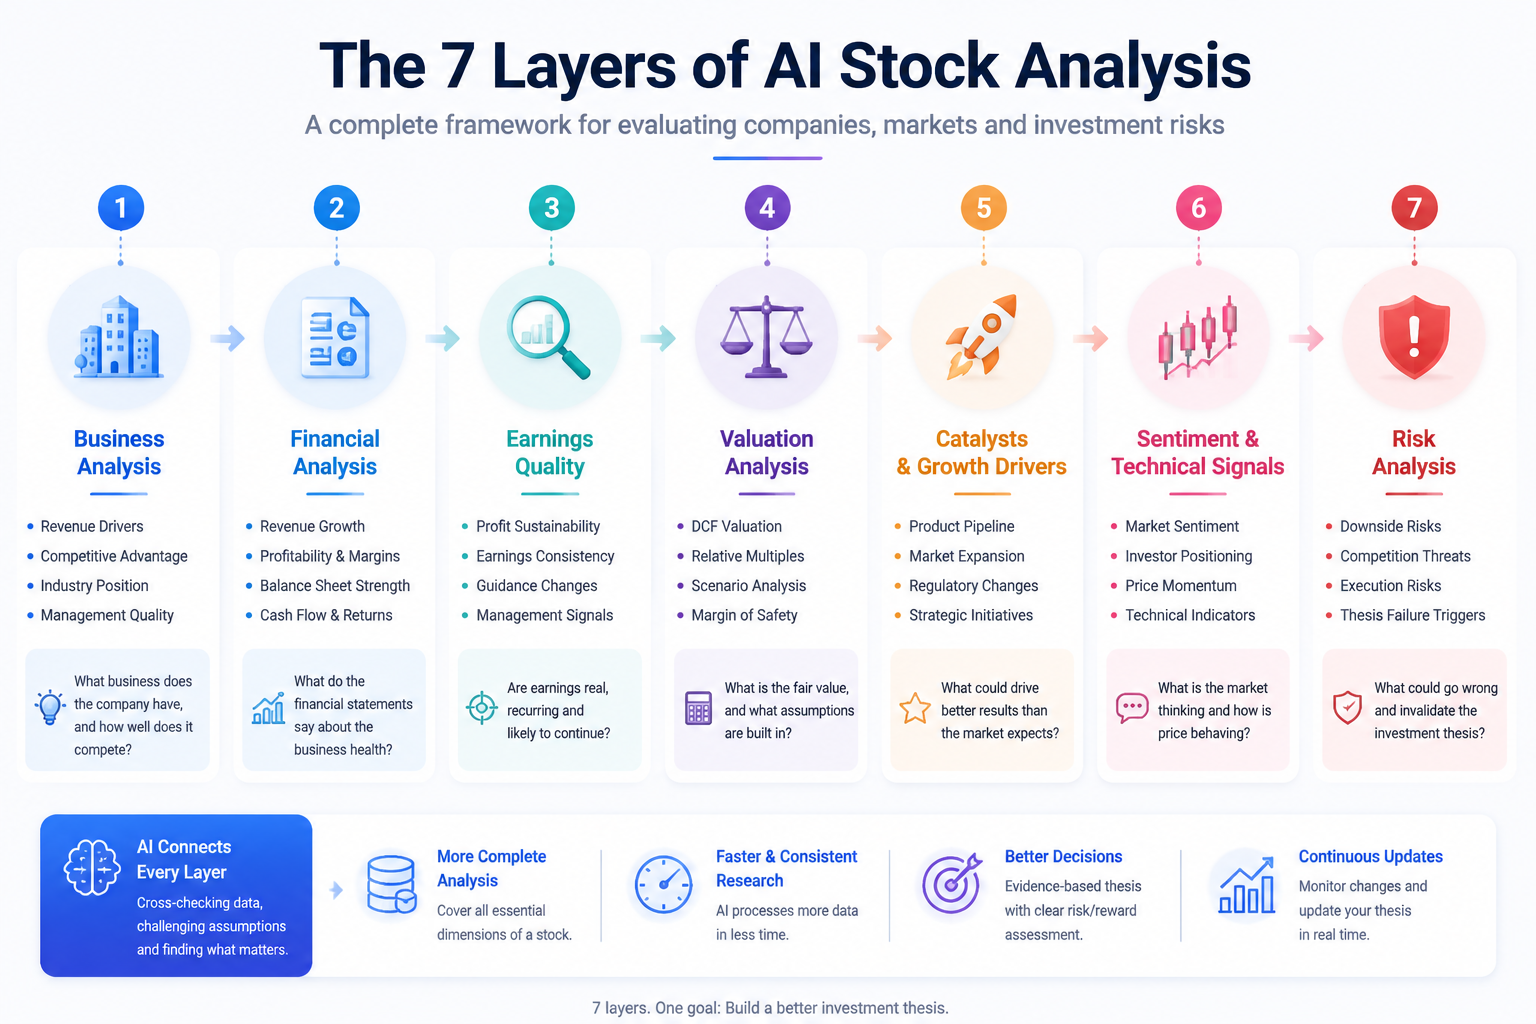
1. Understand the business before studying the ticker
Every stock ticker represents a business, but not every business should be evaluated in the same way. Before opening a valuation model or looking at a chart, an investor should understand what the company sells, who pays it, why customers choose it and where the company is vulnerable.
For NVIDIA stock analysis, the research may focus on data-center demand, AI accelerator performance, networking, gross margin, product cycles, advanced packaging capacity, hyperscaler spending and competition from custom chips. For Apple stock analysis, the central variables may be installed-base growth, iPhone demand, Services revenue, ecosystem retention, China exposure, regulation and capital returns. For a bank, the model changes to net interest income, deposits, credit quality, capital ratios and loan losses.
A generic checklist can appear comprehensive while missing what moves the actual business. The first output of an AI research process should therefore be a company-specific driver map:
Revenue streams and their relative importance
Major products, customers and geographic markets
Industry structure and competitive position
Cost structure, margins and capital intensity
Dependencies on suppliers, regulation or financing
The two or three variables most likely to drive future earnings
This driver map becomes the foundation for later analysis. Without it, investors risk measuring what is easy to retrieve rather than what is economically important.
2. Read the financial statements as a connected story
Fundamental stock analysis is not a contest to collect the largest number of ratios. The income statement, balance sheet and cash-flow statement should explain one another.
Revenue growth matters, but its source matters too. Did it come from higher unit volume, price increases, currency movements, an acquisition or a temporary cycle? Gross margin may rise because the product mix improved, or because a short-term cost declined. Earnings per share may increase even while total profit stagnates if share repurchases reduce the denominator. Free cash flow may temporarily fall because a company is building productive capacity, or structurally weaken because customers are paying more slowly.
A rigorous review should cover revenue growth, gross margin, operating expenses, operating margin, earnings per share, free cash flow, capital expenditure, working capital, cash, debt, share-based compensation, dilution, buybacks and management guidance. The analysis should compare at least three perspectives: the latest quarter versus the prior-year period, recent performance versus management’s earlier guidance, and actual results versus the expectations implied by the market.
The connections are often more revealing than any single figure. Heavy AI infrastructure spending may reduce free cash flow today while building future cloud capacity. That pattern has different implications for Microsoft, Amazon, Alphabet and Meta, because their monetization paths, existing businesses and capital requirements differ.
AI can accelerate earnings report analysis by comparing quarters, extracting changes in guidance and identifying language that management added or removed. But every material figure should remain connected to a dated source. An attractive chart built from stale data is worse than a plain table built from current filings.
3. Test the quality of earnings
Two companies can report the same earnings growth while creating very different economic value. That is why investors should separate accounting performance from the durability of the underlying cash flows.
Useful questions include whether receivables are growing faster than revenue, whether inventory is accumulating, whether capitalized expenses are flattering current profit, whether “adjusted” earnings exclude recurring costs, and whether share-based compensation is offset by real buybacks or simply masked by them. Investors should also distinguish between cyclical margin improvement and structural operating leverage.
For a subscription software company, high retention and efficient customer acquisition may support the quality of reported growth. For a semiconductor company, inventory, customer concentration and cycle timing may matter more. For an industrial business, order backlog is useful only if the orders are profitable, financeable and likely to convert into revenue.
An AI system can flag unusual relationships and changing trends, but the output should be treated as a question generator. A rising receivables ratio is not automatically evidence of manipulation; it is evidence that the investor should investigate customer terms, mix and seasonality.
4. Evaluate valuation as a set of expectations
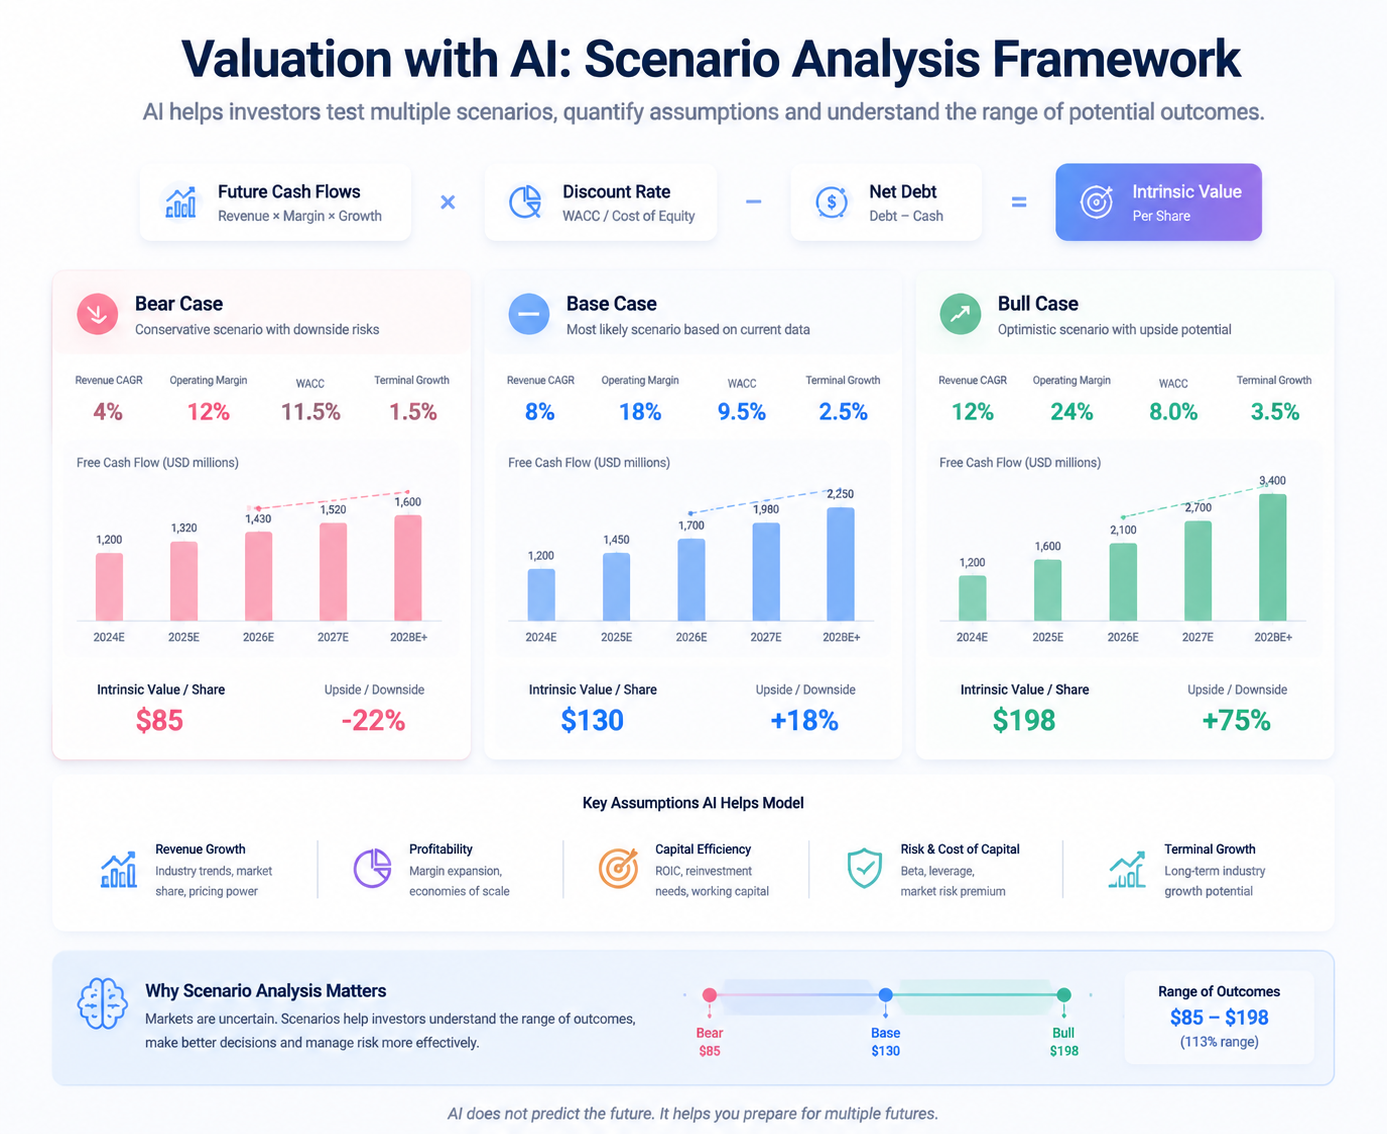
A great company can be a poor investment at the wrong price. A troubled company can produce a strong return if reality is less bad than the market expects. Valuation therefore should not end with “the P/E is high” or “the stock is cheaper than its historical average.”
The better question is: What must happen for today’s price to make sense?
Apply this research method to your stock
Enter one ticker and get a research summary you can keep exploring.
Useful approaches include forward price-to-earnings, enterprise value to EBITDA, price-to-sales, free-cash-flow yield, discounted cash flow, sum-of-the-parts analysis and comparisons with peers or the company’s own history. The correct method depends on the business and its stage of development. A bank should not be valued like a semiconductor designer, and a pre-profit growth company should not be forced into an earnings multiple that has no economic meaning.
AI is especially helpful for scenario analysis. Rather than producing one precise target, a research system can organize bear, base and bull cases. Each case should specify revenue growth, margins, capital needs, dilution, an appropriate valuation multiple and the probability assigned to major optional businesses. The investor can then see which assumption contributes most to the difference in estimated value.
For Tesla stock analysis, for example, valuation can change dramatically depending on whether Tesla is treated mainly as an automaker or whether probability-weighted value is assigned to autonomy, robotaxi, energy storage and robotics. The model should not hide that disagreement inside one number. It should expose the assumptions so that investors can decide which ones they accept.
5. Separate a genuine catalyst from a popular narrative
Stock prices move when expectations change. A catalyst matters when it can alter revenue, margins, cash flow, risk or the valuation multiple investors are willing to pay.
Potential catalysts include earnings results, guidance, product launches, regulatory decisions, interest-rate changes, acquisitions, new contracts, customer wins, commodity-price changes and industry supply constraints. Yet an event is not automatically material just because it receives attention.
The word “AI” is not itself a catalyst. For AMD stock, a new AI accelerator matters only when the research connects the product to customer adoption, revenue, margins and competitive position. For Palantir stock, enthusiasm about an AI platform needs to be tested against commercial growth, deal conversion, customer concentration and operating leverage. For hyperscalers, rising AI capital expenditure should be compared with measurable revenue contribution, cloud demand and the durability of existing cash flows.
A useful AI news analysis process classifies each event with four questions: Is it new? Is it credible? Is it financially material? Is it already reflected in expectations? This prevents investors from confusing repeated headlines with new information.
6. Use sentiment and technical analysis as context
Fundamentals describe what a business may be worth over time. Price action describes what market participants are doing now. Both can matter without being forced into the same conclusion.
Technical stock analysis can provide context about trend direction, support and resistance, trading volume, momentum, volatility and relative performance versus a sector or index. Market sentiment analysis can review analyst estimate revisions, options activity, institutional positioning, news tone and the range of views expressed by investors.
These signals should not become isolated buy or sell buttons. Strong price momentum does not make an expensive valuation safe. Weak momentum does not erase a durable competitive advantage. Sentiment and technical data are most useful for recognizing changes in expectations, managing entry timing, sizing a position and avoiding the assumption that a good business must immediately produce a rising stock.
The most interesting situations often involve disagreement between layers. Fundamentals may improve while price momentum deteriorates because expectations had risen even faster. Conversely, a stock may rally on weak results because investors were positioned for something worse. AI can help identify the disagreement, but the investor must decide which explanation is more persuasive.
7. Define risk and thesis invalidation before acting
Many stock reports devote pages to upside and end with a short paragraph of generic risks. A disciplined process makes the downside specific before the position is opened.
Investors should ask what could cause permanent capital loss, which assumption has the weakest evidence, what upcoming event creates gap risk, how the company would perform in a recession or financing shock, and what fact would invalidate the thesis. The answers should be observable. “Competition may increase” is vague. “Gross margin falling below a defined level for two consecutive quarters because customers shift to a lower-priced competitor” is testable.
For NVIDIA, relevant risks may include export restrictions, customer concentration, supply dependencies, hyperscaler bargaining power and competition. For Tesla, they may include automotive margins, autonomy execution, regulation and valuation sensitivity. For Apple, they may include China demand, hardware concentration, supply-chain exposure and platform regulation.
Risk analysis should also connect the company to the portfolio. A volatile stock may be acceptable at a small weight and dangerous at a concentrated weight. AI can help describe company risk; it cannot know the investor’s complete financial circumstances unless those constraints are explicitly provided.
Why different types of stocks require different analytical models
One of the easiest ways to produce shallow analysis is to use the same template for every ticker. A better research process begins by classifying the business and selecting metrics that reflect its economics.
Company type | Core questions | Useful metrics | Common analytical mistake |
|---|---|---|---|
Semiconductors | Where is the company in the product and demand cycle? Is its advantage durable? | End-market growth, gross margin, inventory, capacity, customer concentration | Extrapolating peak-cycle growth indefinitely |
Cloud and software | Is growth efficient, recurring and supported by retention? | ARR, remaining obligations, retention, sales efficiency, free cash flow | Ignoring dilution and the cost of acquiring growth |
Consumer platforms | Is engagement converting into revenue without weakening the ecosystem? | Users, engagement, monetization, acquisition cost, advertising demand | Treating user growth as automatically valuable |
Banks | How sensitive are earnings and credit losses to rates and the economy? | Net interest margin, deposits, provisions, capital and return on equity | Applying industrial-company valuation ratios without adjustment |
Energy | How do commodity prices, reserves and capital discipline affect cash returns? | Production, realized price, breakeven cost, reserves, capex and distributions | Confusing a commodity upswing with permanent business improvement |
This does not mean every company fits neatly into one category. Amazon combines retail, cloud computing, logistics and advertising. Alphabet combines advertising, cloud services and long-duration technology investments. Tesla combines automotive manufacturing, energy and uncertain future options. For complex companies, the model may need to analyze each segment separately and then bring the pieces together through a sum-of-the-parts framework.
The missing layer in many stock reports: market expectations
A company can beat last year’s results and still disappoint investors. It can report declining profit and still rally. The apparent contradiction disappears once the analysis distinguishes business performance from expectations.
Suppose revenue grows 25 percent. That sounds strong in isolation. If investors expected 35 percent and the stock was valued for flawless execution, the result may weaken the thesis. If investors expected 10 percent and management also raises guidance, the same 25 percent growth can force the market to revise future earnings higher.
A complete stock report should therefore show three separate comparisons:
Direction: Is the business improving or deteriorating?
Expectation: Is performance better or worse than the market anticipated?
Price: Does the valuation offer enough return if the thesis is correct?
This framework is particularly important for popular AI stocks. A company can remain an excellent long-term business while its stock becomes vulnerable because the valuation assumes exceptional growth. Conversely, a company with obvious problems may rally when those problems are already reflected in the price. AI tools should help users analyze this gap rather than simply labeling positive news as bullish and negative news as bearish.
How to judge the quality of evidence in AI stock research
An AI-generated answer is only as reliable as the evidence behind it. Investors should apply an evidence hierarchy.
Primary company sources: regulatory filings, audited financial statements, earnings releases and investor presentations.
Direct external sources: regulator decisions, government statistics, court documents and official industry data.
High-quality secondary reporting: reporting that identifies sources and distinguishes fact from interpretation.
Market commentary: useful for understanding expectations and debate, but not a substitute for primary evidence.
Unverified social claims: potential leads that require confirmation, not facts to place in a valuation model.
Freshness is part of evidence quality. A correct revenue figure from two quarters ago may be misleading after a new earnings release. The report should preserve dates, fiscal periods and source links. It should also distinguish management statements from independently verified outcomes. Management’s claim that a product has a large opportunity is evidence of strategy, not evidence that the opportunity has already converted into profit.
Investors should also watch for false precision. A model that assigns a stock a value of $187.43 may look rigorous, but the decimals do not compensate for uncertain revenue, margin and discount-rate assumptions. It is often more honest to present a range, identify the variables with the greatest sensitivity and explain what evidence would move the range.
Why one AI model is often not enough
Stock analysis contains genuine disagreement. Strong growth may support a bullish thesis while a demanding valuation supports a bearish one. A promising product cycle can coexist with deteriorating price momentum. Management may describe capital expenditure as an investment while free-cash-flow investors view it as an unproven cost.
If one model writes the entire report in a single pass, it may select one narrative early and interpret later evidence to support it. This is similar to confirmation bias in human research. A multi-agent process can reduce that risk by assigning different analytical roles and forcing competing interpretations to confront one another.
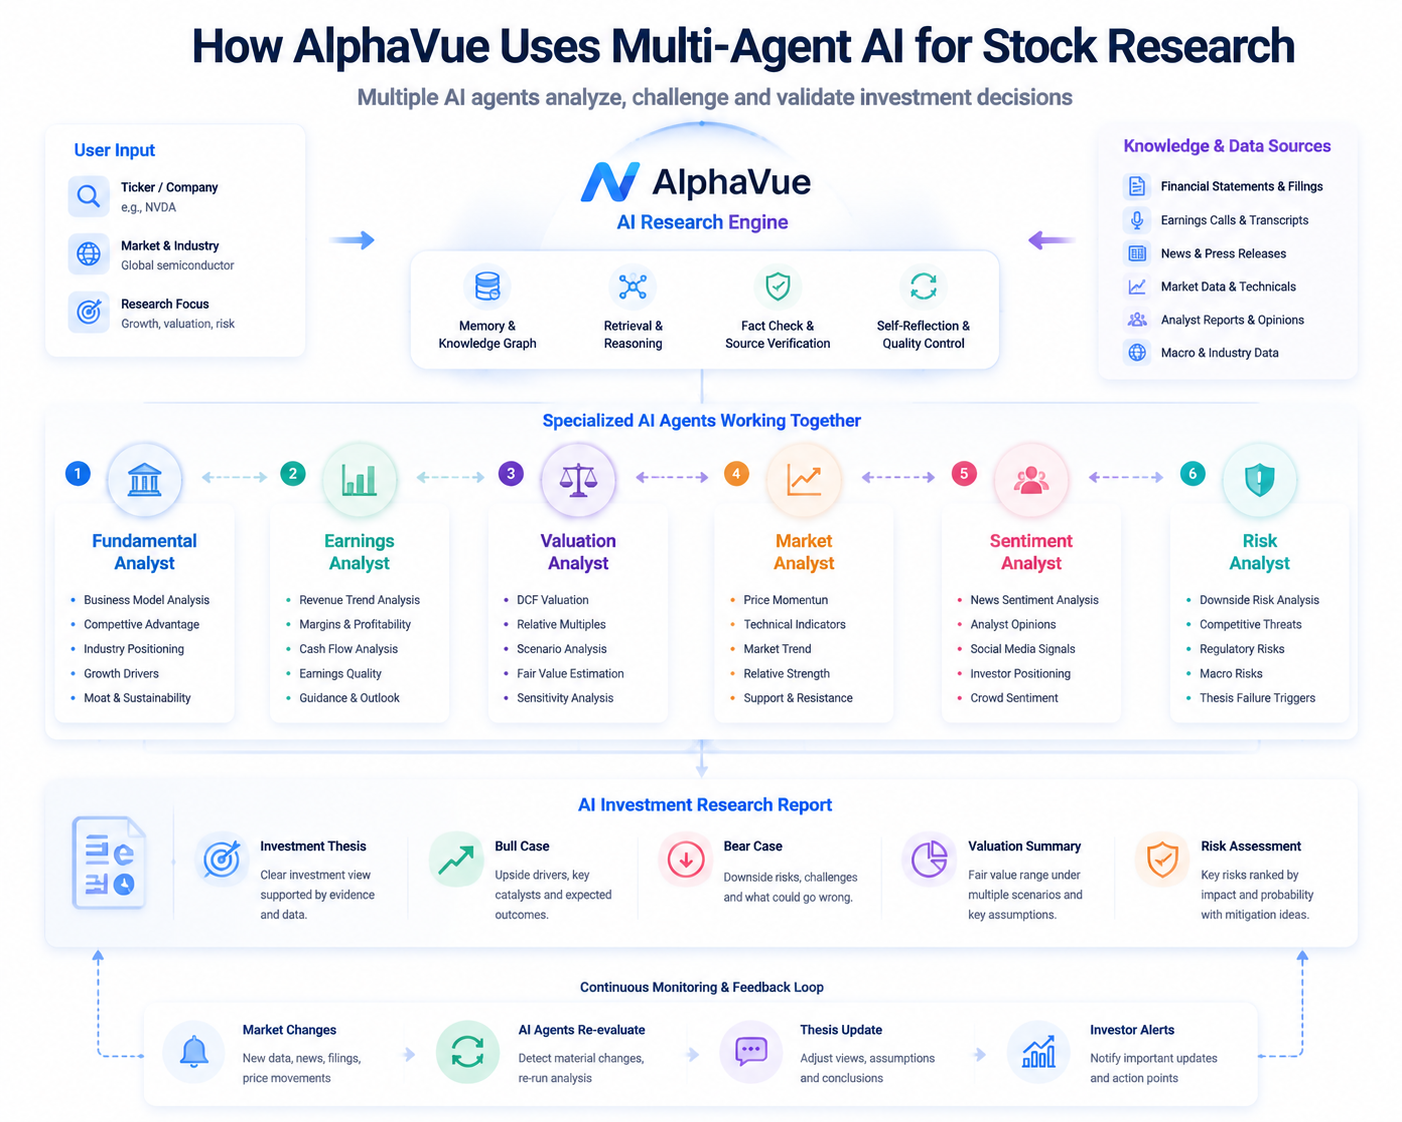
AlphaVue’s research workflow uses specialist agents to examine areas such as company fundamentals, earnings, news, market behavior, valuation, sentiment and risk. Bullish and bearish interpretations can then be compared before the system presents a research verdict. The goal is not to create artificial debate for its own sake. It is to make disagreement visible and reveal which conclusions depend on fragile assumptions.
A trustworthy AI stock analysis platform should show more than a BUY, HOLD or SELL label. It should show the evidence supporting the verdict, the strongest counterargument, the relevant time horizon, the level of confidence, the major risks and the conditions that would change the conclusion. Readers can review AlphaVue’s stock research methodology to understand how evidence, debate and risk fit together.
The same framework applied to NVIDIA, Tesla and Apple
Consider three of the most common stock searches: NVIDIA stock analysis, Tesla stock analysis and Apple stock analysis. The research architecture stays consistent, but the important evidence changes.
Research layer | NVIDIA (NVDA) | Tesla (TSLA) | Apple (AAPL) |
|---|---|---|---|
Core question | Can AI infrastructure demand and platform leadership sustain exceptional economics? | How much value belongs to the auto business versus autonomy, energy and robotics? | Can Services and ecosystem strength offset mature hardware growth? |
Financial focus | Data-center growth, gross margin, supply and customer spending | Deliveries, automotive margin, capex and free cash flow | iPhone demand, Services growth, margin and cash returns |
Valuation tension | Platform advantage versus expectations already embedded in the price | Current automotive economics versus probability-weighted future options | Exceptional business quality versus a slower underlying growth rate |
Potential catalyst | Product adoption, supply expansion and hyperscaler capital spending | Autonomy milestones, deliveries, new products and margin recovery | Product cycles, Services, capital returns and an effective AI strategy |
Key risk | Export controls, competition, concentration and a demand digestion cycle | Execution, regulation, funding needs and valuation sensitivity | China, regulation, hardware concentration and ecosystem pressure |
The NVIDIA analyst needs to determine how much demand is structural and how much reflects an unusually aggressive investment cycle. The Tesla analyst must separate measurable current operations from future businesses with wide probability ranges. The Apple analyst must evaluate whether ecosystem durability and cash generation justify the multiple when hardware growth is less explosive.
This is the difference between an AI-generated summary and AI-assisted investment research. A summary retrieves facts. Research selects the facts that matter, tests the relationships between them and explains what would change the conclusion.
How AlphaVue turns stock research into an ongoing process
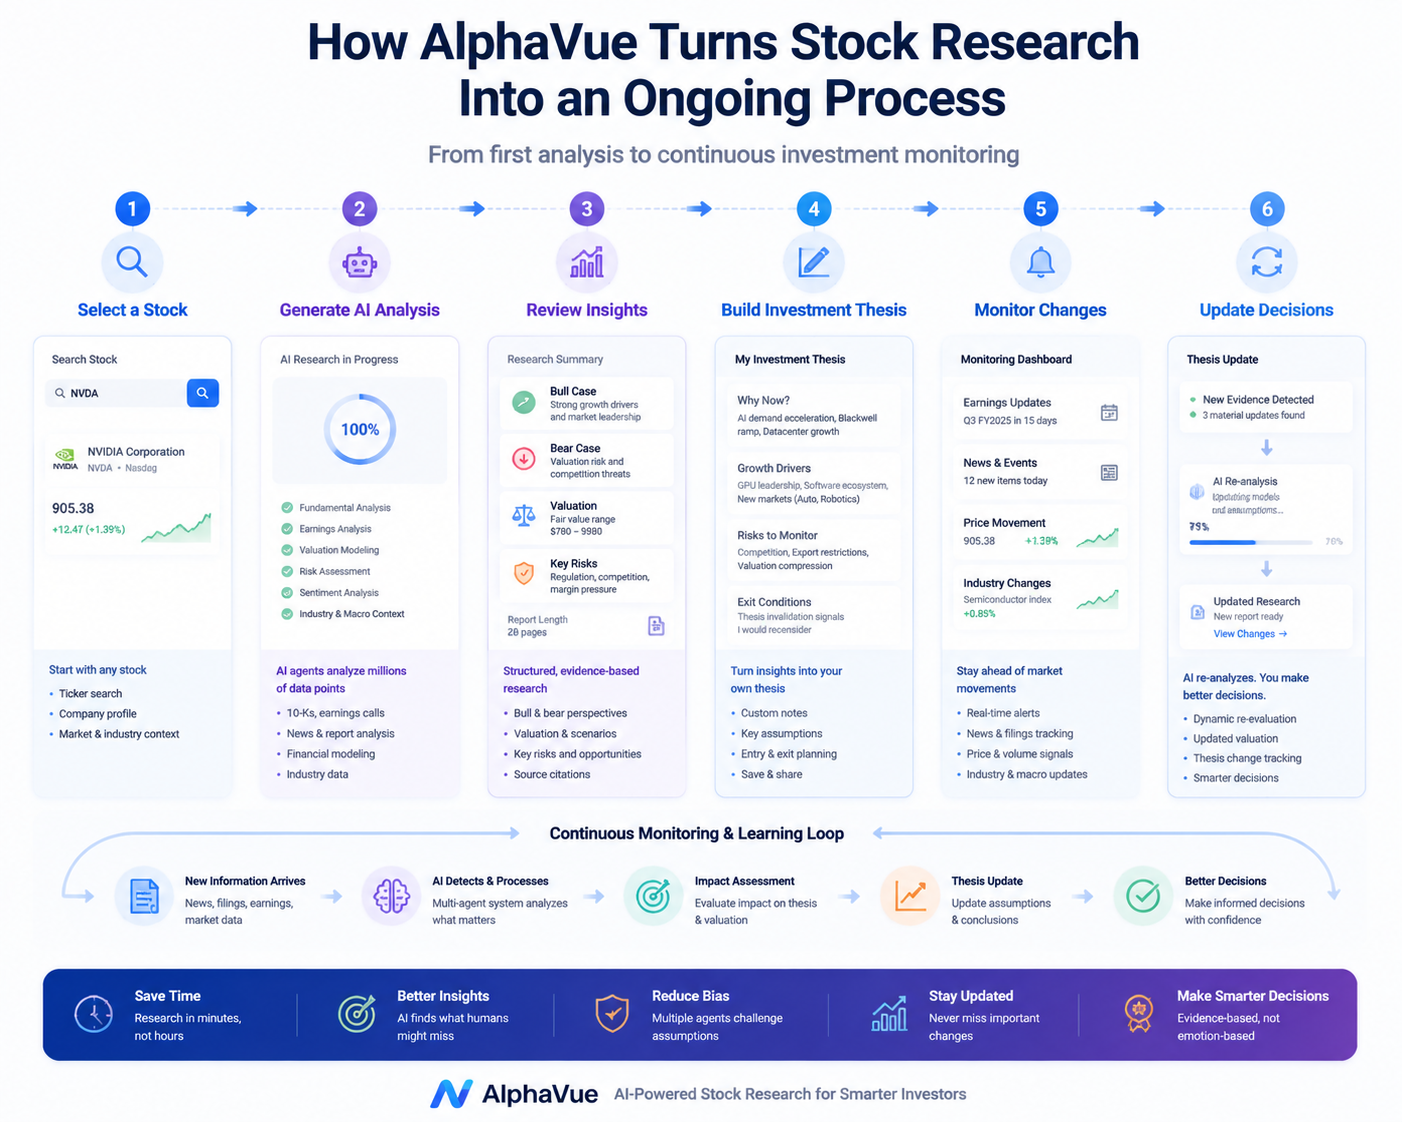
Most stock analysis starts becoming stale as soon as new information arrives. A company reports earnings. Management changes guidance. A regulator intervenes. A competitor launches a product. Interest rates shift. The original report may still look polished while no longer describing the investment.
AlphaVue is designed to support a living research process. Investors can enter a ticker, generate a structured multi-agent analysis, inspect the bull and bear cases, review risk and follow the evidence behind the conclusion. Instead of treating the first report as the end of the work, monitoring helps identify meaningful changes in earnings, valuation, news, price behavior or the thesis itself.
A practical AlphaVue workflow can look like this:
Start with the company: open a ticker and identify its business model, key drivers and current market context.
Generate the research view: allow specialist agents to evaluate fundamentals, earnings, valuation, catalysts, sentiment, technical signals and risk.
Inspect disagreement: compare the bullish and bearish cases instead of reading only the final verdict.
Check the sources: verify material claims, time-sensitive figures and the date of the evidence.
Write your own thesis: state why the opportunity exists, what the market may be missing and what would invalidate the position.
Monitor change: revisit the analysis when a meaningful event affects the thesis rather than reacting to every headline.
The platform supports research across a broad directory of public companies, including technology stocks, semiconductor stocks, AI stocks, financial stocks, healthcare stocks, consumer stocks and energy stocks. Investors can explore the stock research directory or review sample stock research reports.
The purpose is not to outsource the decision. It is to reduce the time spent collecting fragmented information and increase the time spent judging assumptions, probabilities and risk.
What AI stock analysis cannot do
AI investing tools are useful precisely because markets are complex, but they do not eliminate that complexity. Investors should understand five important limits.
AI cannot guarantee a price forecast
Markets respond to unexpected information, changes in liquidity and shifts in collective expectations. A model can estimate scenarios; it cannot know which surprise will arrive next or how investors will react.
AI can use stale or incomplete data
A conclusion may be internally logical and still wrong because a filing, price, estimate or corporate event is outdated. Time-sensitive claims require dates and verification.
AI can mistake correlation for causation
A stock price may rise alongside positive news without the news being the true cause. Multiple variables change at once. Good analysis should distinguish observed relationships from proven explanations.
AI can sound more confident than the evidence allows
Fluent language is not the same as analytical certainty. Investors should prefer explicit assumptions, confidence ranges and counterarguments over a confident paragraph with no source trail.
AI does not know the investor’s complete situation
A stock may be attractive in isolation and inappropriate for a particular portfolio because of concentration, liquidity needs, taxes or risk tolerance. Research support is not personalized financial advice.
The best use of AI is therefore not blind automation. It is supervised research: let the system organize, compare, calculate and challenge, while the investor verifies important evidence and remains responsible for the final decision.
A repeatable checklist for your next stock analysis
Before buying, holding or selling a stock, write down clear answers to the following questions:
How does the company make money?
Which two or three metrics drive the economics of the business?
What changed in the latest earnings report?
Is reported profit supported by free cash flow?
What assumptions are embedded in the current valuation?
What is the bear, base and bull case?
What is the next financially material catalyst?
What is the strongest argument against the thesis?
Which observable fact would invalidate the thesis?
What time horizon does the analysis assume?
How does this position affect total portfolio risk?
Which new event would justify updating the analysis?
If the answers are vague, the research is not finished. If the conclusion cannot survive a reasonable counterargument, the confidence level is probably too high. If the thesis has no invalidation condition, it is a story rather than a decision framework.
Frequently asked questions
What is the best AI tool for stock analysis?
The best AI stock analysis tool depends on the investor’s needs, but it should combine company fundamentals, earnings, valuation, news, market sentiment, technical context and risk. It should identify sources, preserve dates, expose assumptions and present counterarguments rather than returning an unexplained score. AlphaVue is built around an evidence-based, multi-agent workflow designed for these requirements.
Can AI predict stock prices?
No AI system can reliably predict stock prices or guarantee returns. Markets respond to new information and changing expectations. AI can improve research speed, scenario analysis, consistency and monitoring, but uncertainty remains part of investing.
Can AI analyze earnings reports?
Yes. AI can summarize results, compare quarters, identify changes in guidance, extract management commentary and flag unusual relationships. Investors should still verify material figures using company filings and investor-relations sources.
Is AI stock analysis suitable for beginners?
It can be useful for beginners when the system explains the business, evidence, valuation assumptions, risks and counterarguments in plain language. Beginners should avoid treating a BUY or SELL verdict as an instruction and should learn why the conclusion was reached.
How is AlphaVue different from a general chatbot?
A general chatbot normally responds to one prompt. AlphaVue organizes stock research as a continuing workflow: specialist agents analyze different categories of evidence, challenge the investment thesis, assess risk and preserve a source trail. Monitoring can then help investors detect material changes after the first report.
Does AlphaVue provide investment advice?
No. AlphaVue provides research support based on public data and AI-assisted workflows. Its output is not personalized investment advice. Investors remain responsible for verifying time-sensitive information and making decisions that fit their own financial circumstances.
Better investing begins with better questions
AI will not make difficult investment decisions effortless. It can make the research behind those decisions faster, more structured and easier to challenge.
That is the real opportunity. Instead of asking a model to name the next stock that will rise, investors can use AI to understand a business, test valuation assumptions, compare bull and bear cases, identify risks and monitor whether the facts are changing. The result is not certainty. It is a clearer process for making decisions under uncertainty.
Try AlphaVue by entering a ticker and building your first AI stock analysis.
Disclaimer: This article is for informational and educational purposes only. AlphaVue provides research support based on public data and AI-assisted workflows. Nothing in this article constitutes personalized investment, financial, legal or tax advice. Investing involves risk, including possible loss of principal, and no analysis can guarantee future results.