Researching a stock should begin with evidence, not with a prediction. Yet the first hour of company research often feels less like analysis and more like browser management. One tab contains the price chart. Another holds the latest news. Financial statements live somewhere else. SEC filings require a separate search. Earnings dates may come from a calendar with unclear sourcing. Notes accumulate before the investor has answered the most basic question: what kind of business is this, and which facts actually matter?
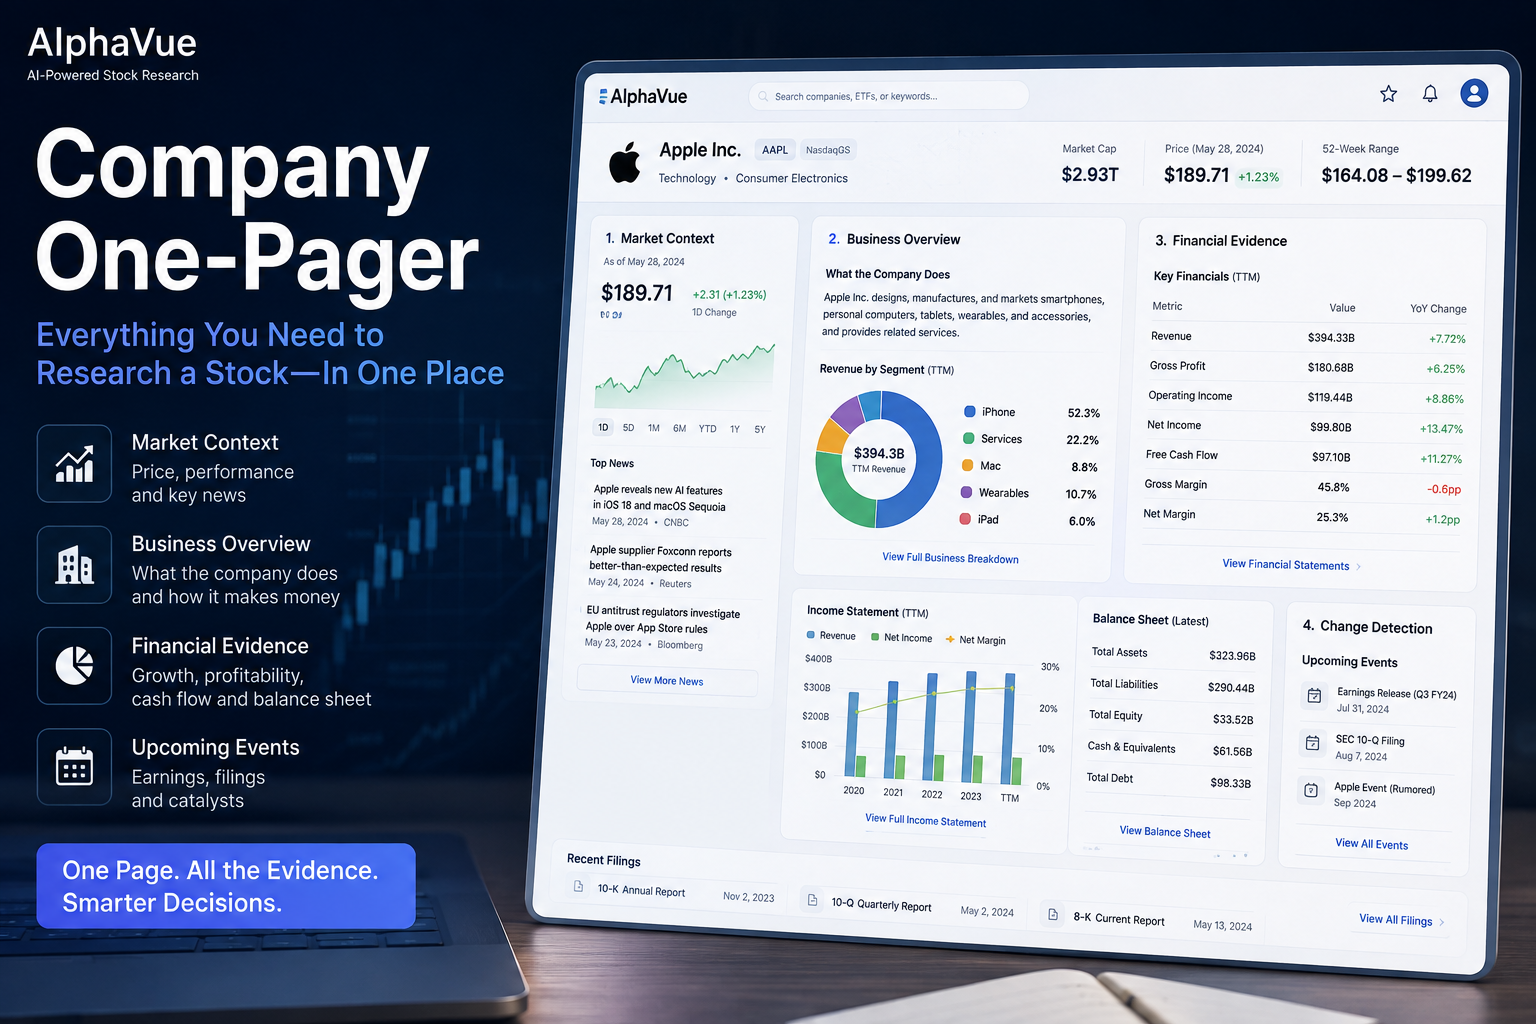
AlphaVue's upgraded Company One-Pager is designed to make that first stage of stock research faster, clearer, and more disciplined. It brings the market context, reported company facts, operating evidence, financial history, regulatory filings, and upcoming events into one structured research workspace. When a question deserves deeper investigation, the same workspace provides a direct path into AlphaVue's full AI research process.
This is not a promise that one screen can tell you whether a stock will rise or fall. No responsible stock research tool can remove uncertainty. The purpose of a company one-pager is more practical: help you understand a company quickly, identify the variables that deserve attention, locate the original evidence, and decide what to investigate next.
Why Researching a Company Still Takes Too Many Tabs
A public company produces an enormous amount of information. Its share price changes every trading day. News develops continuously. Financial results arrive every quarter. A 10-K can exceed one hundred pages, while a 10-Q, 8-K, earnings release, investor presentation, and conference-call transcript may each reveal a different part of the story. Estimates add another layer, and every source uses its own layout, definitions, and update schedule.
The difficulty is not simply finding more data. Most investors already have access to more information than they can use. The harder problem is organizing evidence into a sequence of questions:
What does the company do, and what drives its revenue?
Is growth accelerating, slowing, or changing in quality?
Are margins, cash generation, and balance-sheet strength improving?
Which operating indicators explain the reported financial results?
What does the company disclose in its original SEC filings?
Which upcoming event could change the current interpretation?
What evidence would challenge the investment thesis?
Without a consistent framework, research becomes vulnerable to recency bias. A dramatic price move or headline can dominate attention even when the underlying business evidence has barely changed. The opposite can also happen: an investor may focus on a familiar valuation multiple while missing deterioration in inventory, receivables, cash conversion, or segment mix.
Fragmented research also creates comparison errors. A quarterly number may be compared with an annual figure. A market estimate may be treated as a confirmed company event. A metric without a reporting-period label can appear more current than it is. A summary can circulate without a link to the filing from which it originated. Each mistake looks small, but together they weaken the quality of the decision.
A good stock research dashboard should therefore do more than display many cards. It should establish hierarchy. It should distinguish market movement from business performance, reported facts from interpretation, and confirmed events from estimates. It should show enough context to make a useful first judgment while preserving a path back to the underlying evidence.
What Is a Company One-Pager for Stock Research?
A company one-pager is a compact, structured view of the information an investor needs to begin understanding a public company. The word “one-page” describes the research experience, not a literal promise that every fact fits on a printable sheet. The goal is to keep the essential evidence in one coherent workspace, with clear sections for deeper inspection.
Traditional company profiles usually answer static questions: the company's name, sector, headquarters, market capitalization, and perhaps several valuation ratios. Those facts are useful, but they do not form a research process. A research-oriented company one-pager should connect four layers of evidence:
Market context: what the stock price and recent news are doing now.
Business context: how the company makes money and which segments or regions matter.
Financial evidence: what the reported statements say about growth, profitability, cash generation, and financial strength.
Change detection: which filings or future events could alter the current picture.
This structure matters because investment research is not a collection of isolated ratios. Revenue growth has a different meaning when it comes from price increases rather than volume, an acquisition rather than organic expansion, or one fast-growing segment rather than the whole company. Free cash flow can be strong because operations improved, or because investment temporarily fell. A low valuation multiple can indicate opportunity, cyclically elevated earnings, financial stress, or a business facing structural decline.
The one-pager should not conceal these questions behind a single score. It should help the investor see relationships and then inspect the evidence. That principle shaped the AlphaVue upgrade.
Introducing the Upgraded AlphaVue Company One-Pager
The upgraded Company One-Pager turns AlphaVue's company workspace into a structured starting point for fundamental stock research. At the top, shared market context combines price performance with recent company news. Below it, investors can move through five focused research sections: Overview, Operations, Financial Analysis, Filings & Reports, and Forward Calendar.
The layout is designed for progressive depth. You can begin with a rapid scan, examine operating or financial details when a signal deserves attention, open original filings when verification is necessary, and continue into full AI Research when the initial evidence raises a more complex question.
The upgrade also emphasizes transparent states. Reported periods and source dates matter. Missing operating dimensions remain absent instead of being replaced with invented values. Research assets may be collected and standardized on demand, so sections can indicate that data is still being prepared. Future events distinguish confirmed dates from estimates or inferred windows. These details are not decorative caveats; they are part of responsible investment research.
1. Shared Price Performance and Company News
Every stock research session takes place in a market context. A sharp price movement may reflect earnings, guidance, a regulatory decision, a competitor's announcement, macroeconomic news, or simply a broad market rotation. Looking at a chart without contemporaneous news can encourage speculation. Reading headlines without seeing the price response can make it difficult to judge what the market has already absorbed.
AlphaVue places the stock's price history and recent company news together above the research modes. The shared context remains available whether you are using the Company One-Pager or moving into AI Research. That continuity reduces the need to reconstruct the situation when switching from quick review to deeper analysis.
The chart is not presented as proof that a business is improving or deteriorating. Price is a market signal, not a financial statement. Instead, it helps establish timing. Has the stock moved materially since the last filing? Did volatility increase around a recent announcement? Is the current valuation being considered after a large re-rating? These observations can shape the questions you ask without replacing fundamental analysis.
The news panel serves a similar purpose. Recent articles can identify events that require verification, but a headline should not automatically become a thesis. Investors should distinguish between reported company facts, third-party interpretation, and market commentary. When a news item appears important, the next step is often to locate the associated company announcement or regulatory filing.
2. Overview: Build a 30-Second Company Orientation
The Overview section is designed to answer the first set of questions quickly. It combines key company facts, a metric matrix, reported financial history, and a financial trajectory view. Depending on available data, investors may see measures related to scale, growth, profitability, valuation, cash flow, and financial health.
A rapid orientation should not mean a superficial conclusion. Its purpose is to help you classify the research problem. A profitable compounder, a cyclical manufacturer, a highly leveraged turnaround, and a pre-profit growth company should not be analyzed with the same checklist. The overview helps reveal which analytical lens may be appropriate.
Revenue, gross margin, operating margin, net income, free cash flow, debt, and valuation measures can each contribute to the first picture. Their usefulness depends on context. For example:
Revenue growth can reveal demand, pricing, acquisition effects, or foreign-exchange movement.
Gross margin can signal product mix, pricing power, input costs, or production efficiency.
Operating margin adds the effect of research, sales, and administrative spending.
Free cash flow connects accounting performance with cash generation after capital investment.
Debt and liquidity help show how much flexibility the company has when conditions change.
Valuation ratios describe what the market is paying, but not whether that price is justified.
Historical presentation is important because a single value rarely tells the full story. A 20% operating margin could be excellent for one industry and weak for another. It may also represent improvement from 12% or deterioration from 30%. Annual and quarterly views help investors separate long-term direction from shorter-term volatility.
The Overview section is therefore a starting map. It can tell you where the terrain looks unusual, but it should not decide the route for you.
3. Operations: See the Business Behind the Financial Statements
Financial statements describe outcomes. Operating analysis helps explain how those outcomes were produced. This is especially important when headline growth hides major differences among business lines, geographies, customer groups, or cost drivers.
The Operations section organizes available segment and geographic disclosures alongside an operating metric matrix. The exact information varies by company because businesses report different facts. A semiconductor company may emphasize research and development, inventory, capital expenditure, and end-market mix. A retailer may be better understood through store economics, inventory behavior, and working capital. A bank, insurer, industrial company, or pharmaceutical business requires still another set of drivers.
AlphaVue does not fill unavailable dimensions with generic placeholders. Where reliable segment facts exist, the workspace can show reported business, product, end-market, or geographic dimensions. Where they do not, the absent dimension stays hidden. That protects the investor from confusing presentation completeness with evidence completeness.
The operating metric matrix can include reported or deterministically derived measures such as:
Research and development expense and R&D as a percentage of revenue
Inventory and inventory days
Accounts receivable and days sales outstanding
Capital expenditure and capital expenditure as a percentage of revenue
Stock-based compensation and stock compensation as a percentage of revenue
Operating cash flow and cash conversion
Accounts payable and related working-capital measures
Share repurchases, dividends, net cash, and total debt where available
These metrics can expose questions that an earnings-per-share summary misses. Rising inventory may be preparation for growth, a response to supply constraints, or evidence of slowing demand. Increasing receivables may reflect sales growth or weakening collection quality. High R&D spending may support a durable innovation advantage or produce poor returns. Stock-based compensation may help attract talent while diluting existing shareholders. Capital expenditure may build future capacity, or it may consume cash without generating adequate returns.
The goal is not to assign one universal interpretation. It is to surface the relationship that needs investigation. Once an operating signal is visible, the investor can examine management commentary, segment disclosures, or the relevant filing for an explanation.
4. Financial Analysis: Move From Ratios to Reported Statements
A company financial analysis should make both comparison and verification possible. Ratios help investors scan quality, safety, and valuation. Reported statements show the underlying line items and periods from which those ratios derive.
Apply this research method to your stock
Enter one ticker and get a research summary you can keep exploring.
The Financial Analysis section brings these two views together. A diagnostic matrix can organize measures such as return on equity, return on assets, return on invested capital, liquidity ratios, leverage, free-cash-flow yield, and valuation multiples. The financial statement ledger then provides standardized income-statement, balance-sheet, and cash-flow facts by reporting period.
This combination helps prevent a common mistake: treating a calculated metric as self-explanatory. Return on equity can rise because profitability improved, because leverage increased, or because the equity base declined. Free-cash-flow yield can look attractive when cash generation is temporarily elevated. A price-to-earnings ratio can become misleading when earnings sit near the peak or trough of a cycle. The statement details allow the investor to investigate what drives the ratio.
A useful sequence is to begin with three questions:
Is the business growing? Examine revenue and relevant segment trends across annual and quarterly periods.
Is growth creating economic value? Review margins, operating income, cash generation, capital intensity, and returns on capital.
Can the balance sheet support the strategy? Inspect cash, debt, liquidity, working capital, buybacks, dividends, and major financing needs.
After that initial review, industry-specific questions become more important. A capital-light software company and an integrated energy producer cannot be compared using free cash flow alone. One may expense much of its investment through R&D and stock compensation; the other may require large physical capital expenditures and operate through a commodity cycle. The AlphaVue workspace provides a common structure, but good analysis still requires business context.
5. Filings & Reports: Keep Original Evidence Within Reach
Third-party summaries can accelerate research, but public-company filings remain essential evidence. Form 10-K presents annual financial statements, business descriptions, risk factors, management discussion, controls, and other disclosures. Form 10-Q updates investors on quarterly results and changes in financial condition. Form 8-K can disclose earnings releases, leadership changes, acquisitions, financing events, material agreements, and other significant developments.
The Filings & Reports section organizes original regulatory evidence by filing date and can provide filing-type and year filters. Where available, the workspace displays the filing date, reporting-period end, source, and processing status, together with a link to open the original SEC document.
This matters for two reasons. First, source proximity improves verification. If a summarized claim affects your thesis, you should be able to inspect the original wording, accounting note, risk disclosure, or exhibit. Second, filings help resolve ambiguity. A news story may say that revenue “beat expectations,” while the filing explains changes in customer concentration, deferred revenue, inventory commitments, restructuring costs, or segment profitability.
Investors do not need to read every filing from beginning to end during an initial screen. A focused approach can begin with:
Business and segment descriptions
Management's discussion of results and liquidity
Risk factors that changed materially
Revenue recognition and significant accounting policies
Debt maturities, commitments, contingencies, and legal proceedings
Share-based compensation, repurchases, and changes in share count
Acquisition details and segment reporting
The important principle is simple: a convenient dashboard should shorten the path to evidence, not replace evidence with an unexplained output.
6. Forward Calendar: Know What Could Change the Story Next
A stock thesis is always dated. New earnings, guidance, product launches, regulatory decisions, dividends, or corporate actions can change the relevant facts. The Forward Calendar helps investors see upcoming company events without treating every date as equally certain.
AlphaVue distinguishes confirmed, estimated, and inferred events. A confirmed date is supported by reliable event information. An estimated earnings date is a market estimate rather than an official company commitment. An inferred window is less precise and should be treated accordingly. Where available, earnings events may also include consensus figures such as expected earnings per share or revenue.
This distinction protects against false precision. Many financial calendars display a single date even when the company has not announced it. Investors may then plan around that date as though it were fixed. By showing event status and date precision, the Company One-Pager makes uncertainty visible.
The calendar is most useful when connected to a research question. Before earnings, you might record the revenue driver, margin assumption, or operating metric that needs confirmation. After the event, you can compare the new evidence with the previous expectation. The event becomes a checkpoint in a continuing research process rather than a reason to guess a one-day price reaction.
The Practical Value of the Upgrade
The value of a stock research platform is not measured by how many numbers it can place on a screen. It is measured by whether it improves the user's process. The Company One-Pager upgrade aims to create value in five practical ways.
Reduce Research Fragmentation
Combining market context, company facts, operating metrics, financial statements, filings, and events reduces repeated searching and tab switching. This does not eliminate the need for external verification, but it gives the research session a stable home. Notes and questions can be formed around a consistent set of sections instead of an accidental collection of open pages.
Make the First Pass Faster
Not every company deserves hours of immediate work. A structured first pass can help determine whether you understand the business, whether the available evidence fits your strategy, and which uncertainties would require more time. Faster screening is valuable when it prevents low-quality deep dives, not merely when it encourages more trades.
Connect Business Drivers With Financial Outcomes
Separating Operations from Financial Analysis makes an important relationship visible. Financial results tell you what happened; operating evidence can help explain why. Moving between segment mix, R&D, inventory, receivables, capital expenditure, cash generation, and reported statements encourages analysis that goes beyond a single headline metric.
Preserve Source Awareness
Periods, filing dates, event status, and links to original sources help users judge freshness and reliability. This is particularly important in fast-moving markets. A perfectly calculated ratio based on an old reporting period may be less useful than a recent company disclosure. A confident narrative based on stale market context can be dangerous.
Create a Clear Handoff to Deeper AI Research
The Company One-Pager and AI Research are two modes of the same broader workflow. The one-pager is optimized for structured orientation and evidence scanning. Full AI Research is suited to questions that require synthesis across market, fundamental, news, macroeconomic, sentiment, valuation, and risk perspectives.
This separation is deliberate. Artificial intelligence is most useful when it works on a well-defined question and relevant evidence. Asking for a sweeping conclusion before understanding the company can produce an answer that sounds complete while hiding weak assumptions. The one-pager helps users formulate better questions before requesting deeper analysis.
How to Research a Stock With the AlphaVue Company One-Pager
A repeatable process is more valuable than an impressive dashboard used without discipline. The following workflow can help investors move from a ticker symbol to a focused research agenda.
Step 1: Establish the Market and News Context
Begin with the price chart and recent news. Do not decide whether the stock is attractive yet. Instead, identify why it is on your radar. Has the price moved after earnings? Is the company involved in a major product cycle, regulatory event, acquisition, or industry shift? Has the market re-rated the stock without a comparable change in reported fundamentals?
Write the trigger in one sentence. For example: “The stock fell after management reduced near-term guidance, and I want to determine whether the issue is temporary or structural.” A clear trigger prevents the research process from drifting toward whichever metric looks most exciting.
Step 2: Explain the Business Before Studying the Valuation
Use the Overview and Operations sections to answer: what does the company sell, who buys it, and what drives revenue and profit? If segment or geographic disclosures are available, identify which parts of the business are growing and which generate most of the economic value.
If you cannot explain the business in a few sentences, valuation ratios will not solve the problem. A low multiple is not meaningful when you do not understand the durability of earnings. A high multiple cannot be evaluated without a view of growth, margins, reinvestment, and competitive advantage.
Step 3: Trace Growth From Revenue to Cash
Review annual and quarterly history. Start with revenue, then move through gross profit, operating income, net income, operating cash flow, capital expenditure, and free cash flow. Look for consistency as well as direction.
Several patterns deserve attention:
Revenue rises while gross margin falls.
Net income grows faster than operating cash flow.
Free cash flow improves because capital expenditure has been deferred.
Earnings per share rises while the share count or stock compensation changes materially.
Strong consolidated growth depends on one segment or geographic market.
Quarterly acceleration conflicts with the longer annual trend.
None of these patterns is automatically positive or negative. Each creates a question that should be tested against the company's disclosures.
Step 4: Examine Operating Signals
Use available operating metrics to investigate the mechanism behind the financial results. Inventory days, receivable collection, R&D intensity, capital investment, stock compensation, and segment mix can change before the headline earnings narrative does.
Compare related measures rather than reading each in isolation. If inventory rises, compare it with revenue growth and management commentary. If receivables grow faster than sales, inspect collection trends and customer concentration. If R&D expands, ask whether it supports a product transition and whether gross profit can finance it. If buybacks are large, compare repurchase spending with stock-based compensation and total share count.
Step 5: Test Financial Resilience
Review cash, debt, liquidity, and cash generation. Ask what happens if revenue slows, margins compress, or refinancing becomes more expensive. A company with a strong balance sheet may have time to invest through a downturn. A highly leveraged business may face strategic constraints even when its income statement still looks healthy.
For cyclical companies, avoid assuming that current peak cash flow will persist. For rapidly growing companies, examine whether growth requires increasing working capital or capital expenditure. For acquisitive companies, consider debt, integration demands, intangible assets, and the difference between reported and organic performance.
Step 6: Open the Filing That Can Confirm or Reject the Story
Move to Filings & Reports when a claim becomes important. If the thesis depends on segment growth, inspect the segment note. If cash conversion looks unusual, review the cash-flow statement and working-capital discussion. If management emphasizes adjusted earnings, reconcile the adjustments with reported results. If risk is central to the opportunity, read the relevant risk factor and any update since the annual report.
This step converts a plausible story into evidence-based research. It also helps identify what is missing. A company may not disclose the metric you want, or its reporting structure may change. Absence of evidence should not be silently converted into certainty.
Step 7: Mark the Next Evidence Date
Use the Forward Calendar to identify when the thesis can be tested again. Record whether the event is confirmed or estimated. Define what you expect to learn: revenue growth, a margin inflection, product adoption, regulatory progress, capital allocation, or a change in guidance.
A useful thesis includes an update rule. Instead of writing “I like the company,” write: “My interpretation depends on segment growth remaining above a defined level while inventory growth normalizes and free-cash-flow margin remains within a reasonable range.” The specific thresholds will depend on the company, but the discipline is universal.
Step 8: Continue Into AI Research With a Better Question
When the one-pager reveals a complex issue, switch to AI Research and ask a focused question. Examples include:
What evidence supports and challenges the durability of this segment's growth?
How could a change in gross margin affect valuation under different scenarios?
Which filing disclosures create the greatest risk to the current thesis?
Does recent price movement reflect a change in fundamentals or a change in market expectations?
What upcoming catalyst could confirm or invalidate the investment case?
A specific question produces a more auditable research path than a generic request to “analyze this stock.” It also makes disagreements visible. Investors can compare assumptions, evidence, and alternative interpretations rather than accepting a single confident conclusion.
A Company Research Checklist You Can Reuse
The following checklist summarizes the workflow. It can be used whether you complete the research in AlphaVue, another stock research tool, or directly from company and SEC sources.
Research area | Question to answer | Evidence to inspect |
|---|---|---|
Market context | Why is the stock being researched now? | Price history, volume, recent news, market events |
Business model | How does the company make money? | Company description, products, customers, segments, geography |
Growth | Where does growth come from, and is it durable? | Annual and quarterly revenue, segment trends, volume and pricing |
Profitability | Does growth translate into improving economics? | Gross margin, operating margin, net margin, returns on capital |
Cash quality | Do reported earnings convert into cash? | Operating cash flow, capital expenditure, free cash flow, working capital |
Financial strength | Can the company withstand a weaker scenario? | Cash, debt, liquidity, maturities, commitments |
Capital allocation | How is management using shareholder capital? | R&D, acquisitions, capital expenditure, buybacks, dividends |
Valuation | Which expectations appear embedded in the price? | Multiples, normalized earnings, cash flow, scenarios, peer context |
Risk | What evidence could invalidate the thesis? | Risk factors, customer concentration, competition, regulation, balance sheet |
Next event | When will material new evidence arrive? | Confirmed or estimated earnings, filings, corporate events |
A checklist does not make investing mechanical. It creates a minimum standard. The same categories can be applied consistently while the importance of each item changes by industry and company. Consistency makes it easier to notice when enthusiasm causes you to skip an uncomfortable question.
Why AlphaVue Separates Reported Evidence From AI Interpretation
AI can summarize large documents, compare perspectives, identify relationships, and help investors explore scenarios. It can also produce errors, rely on incomplete context, or express uncertainty poorly. For financial research, interface design should make the boundary between reported evidence and AI interpretation clear.
The Company One-Pager emphasizes structured company and market evidence. Its company-health signals are based on reported facts and deterministic calculations rather than being presented as an unexplained language-model score. Full AI Research is a separate mode for deeper synthesis. This allows users to see the foundational data before reviewing an AI-assisted conclusion.
The distinction improves research in three ways. First, it makes verification easier. Second, it helps users recognize when a conclusion depends on an assumption rather than a reported fact. Third, it makes stale analysis easier to detect. If the price, filing set, or event context changes materially, an earlier interpretation may need to be refreshed even if it was reasonable when created.
AI research should be treated as an analytical aid, not as personalized investment advice or an autonomous trading instruction. Users should review source dates, open important filings, verify facts that may have changed, and evaluate every conclusion against their own objectives, risk tolerance, and financial circumstances.
Designed for Fast Scanning Without Hiding Complexity
The visual upgrade supports the research model. The workspace uses a clear mode switch between Company One-Pager and AI Research, followed by persistent navigation across the five company-research sections. On desktop, the research area keeps the navigation available while the selected section can be explored. On mobile, the layout follows the natural page flow to avoid an awkward nested-scrolling experience.
Color is used primarily for selection, state, and financially meaningful positive or negative change. The design avoids turning every number into a brightly colored signal. That restraint is important: financial data already carries cognitive weight, and excessive decoration can make ordinary values feel more decisive than they are.
The interface also adapts to available evidence. Missing segments are not rendered as large empty charts. Confirmed and estimated events use different statuses. Financial statement periods can be selected rather than stacking every statement into an unreadable page. These choices make the workspace easier to scan while preserving the complexity that matters.
What the Company One-Pager Does Not Do
A credible product description should define its limits. AlphaVue's Company One-Pager does not guarantee that every dataset is available for every company at every moment. Coverage varies with the issuer, source, reporting practices, market, and collection status. Some research assets are collected and standardized on demand, so a section may initially be partial or still preparing.
It does not make estimated event dates official. Always check the displayed status and verify time-sensitive events through company investor-relations materials or other authoritative sources.
It does not turn a valuation multiple into a fair-value conclusion. Valuation depends on assumptions about future growth, profitability, capital requirements, risk, and opportunity cost. Historical results can inform those assumptions but cannot guarantee future performance.
It does not replace original filings, professional advice, or independent judgment. Market data, news, filings, estimates, and AI outputs may be delayed, incomplete, inconsistent, or affected by upstream errors. Investors should verify material facts before making a decision.
Most importantly, the Company One-Pager does not tell every investor to reach the same conclusion. Two investors can interpret the same company differently because they use different time horizons, required returns, portfolio constraints, or views of uncertainty. The product's value lies in making the evidence and questions easier to organize.
From a Ticker Symbol to a Researchable Thesis
The first stage of company research should produce clarity, not certainty. After using a company one-pager, you should be able to describe the business, identify its major financial and operating drivers, locate the original filings, name the next important event, and state what evidence would change your mind.
That is the practical goal of AlphaVue's upgrade. The Company One-Pager provides a faster route through the facts without pretending that the facts interpret themselves. It helps investors replace an unstructured collection of tabs with a repeatable research workflow, then continue into deeper AI-assisted analysis when the question requires it.
Choose a company you want to understand and begin with the AlphaVue Company One-Pager. Start with the market context, follow the evidence through operations and financials, verify the decisive facts in original filings, and define what you need to learn next.
Frequently Asked Questions
What is the AlphaVue Company One-Pager?
The AlphaVue Company One-Pager is a structured stock research workspace that brings together price context, recent company news, reported company facts, operating metrics, financial analysis, SEC filings, and upcoming company events. It is designed to help investors complete a disciplined first review before moving into deeper AI Research.
How can I research a stock before investing?
Begin by understanding the business model and why the stock is on your radar. Then review revenue, margins, cash flow, balance-sheet strength, segment performance, operating indicators, valuation, SEC filings, risks, and upcoming events. Record which evidence supports the thesis and what would disprove it. No checklist removes investment risk, but a repeatable process can reduce avoidable research gaps.
Which financial metrics should I examine when analyzing a company?
The relevant metrics depend on the industry, but a general review often includes revenue growth, gross and operating margins, net income, operating cash flow, free cash flow, returns on capital, cash, debt, liquidity, capital expenditure, stock-based compensation, and valuation multiples. Operating measures such as inventory, receivables, R&D intensity, and segment mix can help explain changes in the financial statements.
Why are SEC filings important for stock research?
SEC filings contain the company's original regulatory disclosures, including financial statements, business descriptions, risk factors, management discussion, accounting notes, commitments, and material events. Summaries can save time, but investors should inspect the original filing when a claim is important to the investment thesis.
Does the Company One-Pager provide real-time data?
Data timing varies by source and dataset. Market data, news, filings, financial statements, estimates, and company events can update on different schedules. Users should check the displayed period, date, and collection status, and independently verify facts that are time-sensitive or material to a decision.
Are earnings dates in the Forward Calendar confirmed?
Not always. AlphaVue distinguishes confirmed, estimated, and inferred events where the supporting data permits. An estimated earnings date is not an official company announcement. Check the event label and verify important dates with the company's investor-relations materials.
How is the Company One-Pager different from AlphaVue AI Research?
The Company One-Pager is optimized for fast orientation, structured reported evidence, and source inspection. AI Research is designed for deeper synthesis across multiple analytical perspectives. Investors can use the one-pager to identify the right question and then switch to AI Research when they need a more detailed examination of fundamentals, valuation, market context, catalysts, or risk.
Can AI tell me whether I should buy a stock?
AI can assist with research, but it cannot eliminate uncertainty or determine what is appropriate for every investor. AI output may contain errors or omit relevant context. Treat it as one input, verify important evidence, consider alternative scenarios, and seek qualified professional advice when necessary.
Is AlphaVue's Company One-Pager investment advice?
No. The Company One-Pager provides research information and tools. It does not account for an individual's objectives, financial situation, tax position, portfolio constraints, or risk tolerance. Nothing in the workspace or this article should be interpreted as a recommendation or solicitation to buy or sell a security.
Who is the Company One-Pager designed for?
It is designed for self-directed investors and research users who want a faster, more organized way to understand public companies. Beginners can use the structure to learn what evidence matters, while experienced investors can use it as a repeatable first-pass dashboard before conducting deeper due diligence.